WTI Crude Oil Analysis: Key Levels at $68.85 and Bearish Momentum Insights
Oil was flat on Wednesday with WTI at $68.85. Markets are watching the ceasefire between Israel and Hezbollah brokered by the US and France.

Oil was flat on Wednesday with WTI at $68.85. Markets are watching the ceasefire between Israel and Hezbollah brokered by the US and France.

The deal ends a long running conflict along the Israeli-Lebanese border which escalated after the Gaza war last year. Israeli PM Benjamin Netanyahu said his government will respond to any breaches of the agreement.
Hiroyuki Kikukawa, president of NS Trading, said the market is uncertain about the ceasefire holding. “WTI will trade between $65-$70, depending on geopolitics, winter weather and US shale oil under Trump,” Kikukawa added.
This geopolitical relief has taken some pressure off the oil prices but traders are still cautious about the long term.
OPEC+ Debates Delayed Output Hikes
OPEC+ meets on December 1 to finalise its production policy for 2025. The group which supplies nearly half of the world’s oil had planned to increase output gradually from January 2024. But slow demand in China and rising production outside the group has led to discussions to delay these hikes.
Citi Research said OPEC+ might delay tapering of cuts until April 2025. “Delaying the unwind of cuts could allow the market to stabilise, balance supply disruptions with demand that is still resilient,” their report said. A quick return of barrels could trigger lower prices and undermine the group’s strategy.
The upcoming meeting will be pivotal in shaping oil’s supply-demand dynamics as OPEC+ seeks to maintain price stability in an uncertain market.
Crude Oil Technical Analysis: Key Levels and Momentum
WTI crude oil is trading near $68.85, showing minor recovery after testing support at $68.02.
On the 4-hour chart, the price is constrained by immediate resistance at $69.36 (pivot point) and a descending trendline, while further resistance lies at $69.68 and $70.26.
Downside risks persist, with immediate support at $68.02, followed by $67.05 and $66.07.
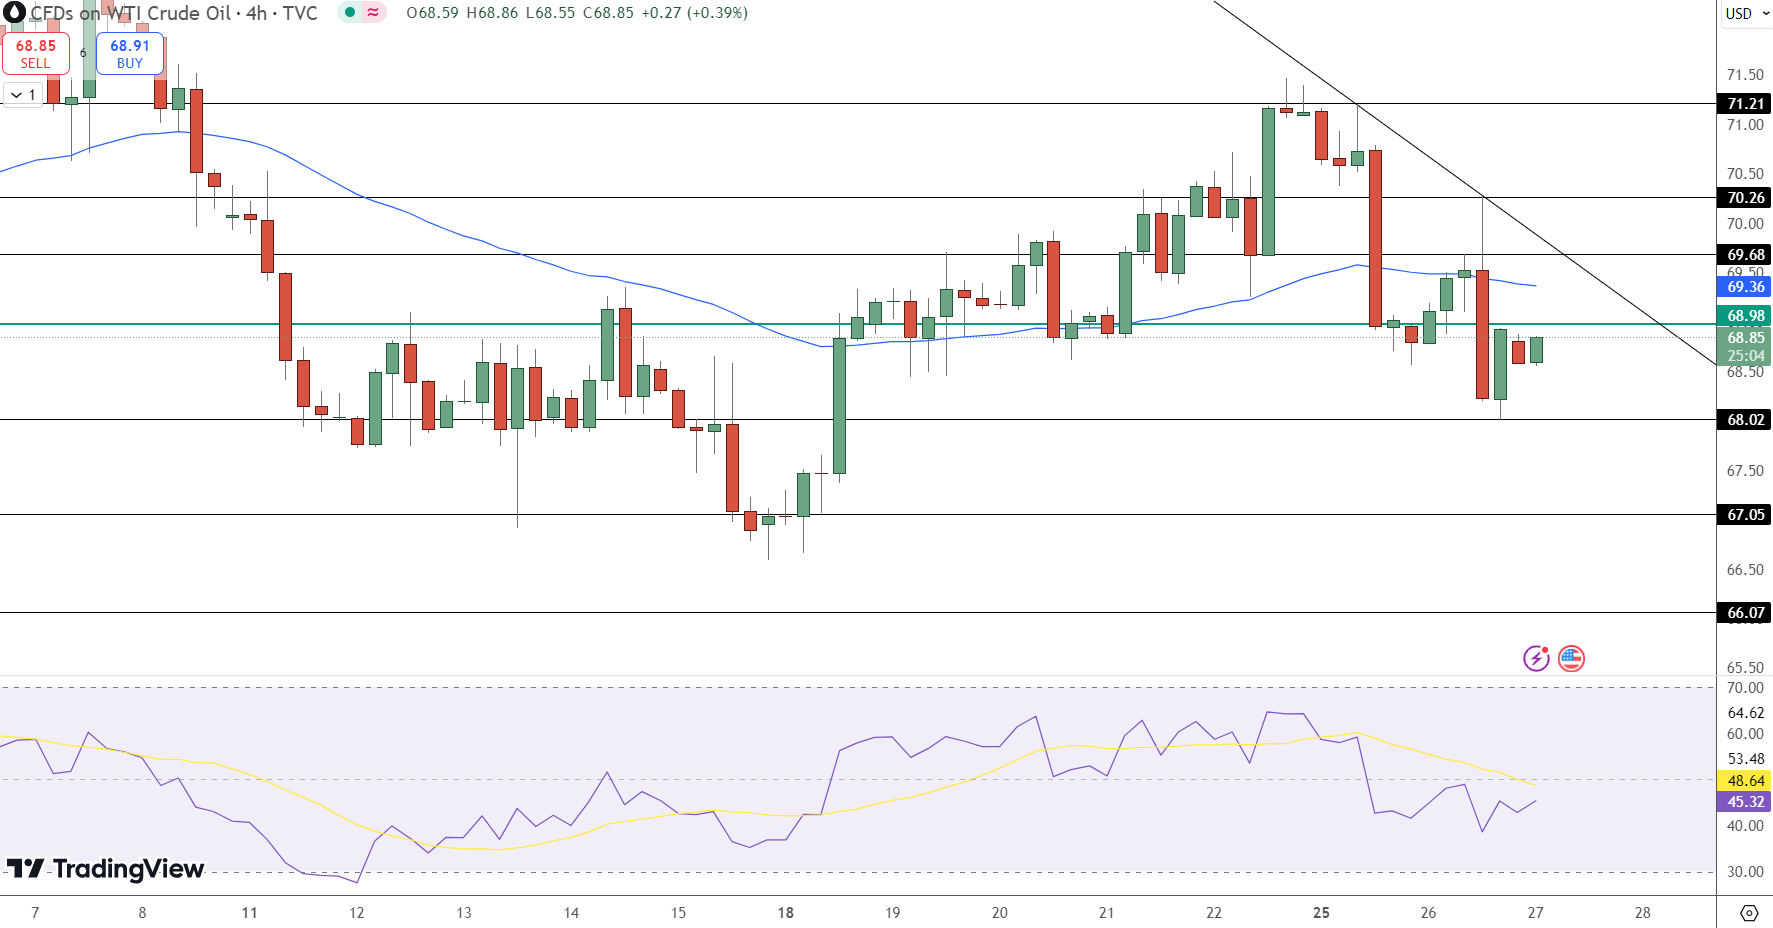
The RSI at 48.64 reflects neutral momentum with a slight bearish tilt, as the price struggles to gain significant upward traction. The 50 EMA, also positioned at $69.36, adds dynamic resistance, reinforcing bearish sentiment.
A breakout above $69.36 could pave the way for a recovery toward $70.26, while failure to hold above $68.02 may accelerate a decline to $66.07.
Key Takeaways
-
Ceasefire Relief: Israel-Hezbollah ceasefire lowers geopolitical risks, stabilizing oil near $68.85.
-
OPEC+ Decision: Talks of delaying output hikes to April 2025 aim to stabilize prices amid weak demand.
-
Technical Analysis: Resistance at $69.36; support at $68.02; RSI at 48.64 reflects bearish momentum.
- Check out our free forex signals
- Follow the top economic events on FX Leaders economic calendar
- Trade better, discover more Forex Trading Strategies
- Open a FREE Trading Account
- Read our latest reviews on: Avatrade, Exness, HFM and XM
Related Articles


Sidebar rates
Related Posts
