Silver (XAG) Price Forecast: Will $30 Break Amid Geopolitical Tensions and Inflation?
Silver prices (XAG/USD) are trading at $29.60, marking a 0.12% increase as the metal continues to draw investor attention.
Silver prices (XAG/USD) are trading at $29.60, marking a 0.12% increase as the metal continues to draw investor attention.

Ongoing geopolitical tensions and concerns over inflation have amplified the appeal of safe-haven assets, with silver benefiting as a more affordable alternative to gold. Additionally, expectations for economic recovery in China and proactive government policies are bolstering optimism, making silver a preferred hedge against global uncertainty.
The demand for silver is also supported by its dual role as an industrial commodity and a store of value. Inflationary pressures and a weaker global economic outlook have made the metal increasingly attractive, with further gains anticipated if these factors persist.
Silver Technical Analysis: Key Levels to Watch
Silver’s bullish momentum is evident as it holds above the pivot point at $29.34, signaling strong market sentiment. Immediate resistance is positioned at $29.88, with further upside targets at $30.43. On the downside, key support levels are at $28.78 and $28.32, providing a safety net for potential pullbacks.
-
50 EMA: Silver remains above its 50-day Exponential Moving Average at $29.51, reinforcing short-term bullish momentum.
-
200 EMA: The 200-day EMA at $30.37, however, highlights potential longer-term resistance, requiring a sustained breakout to confirm further gains.
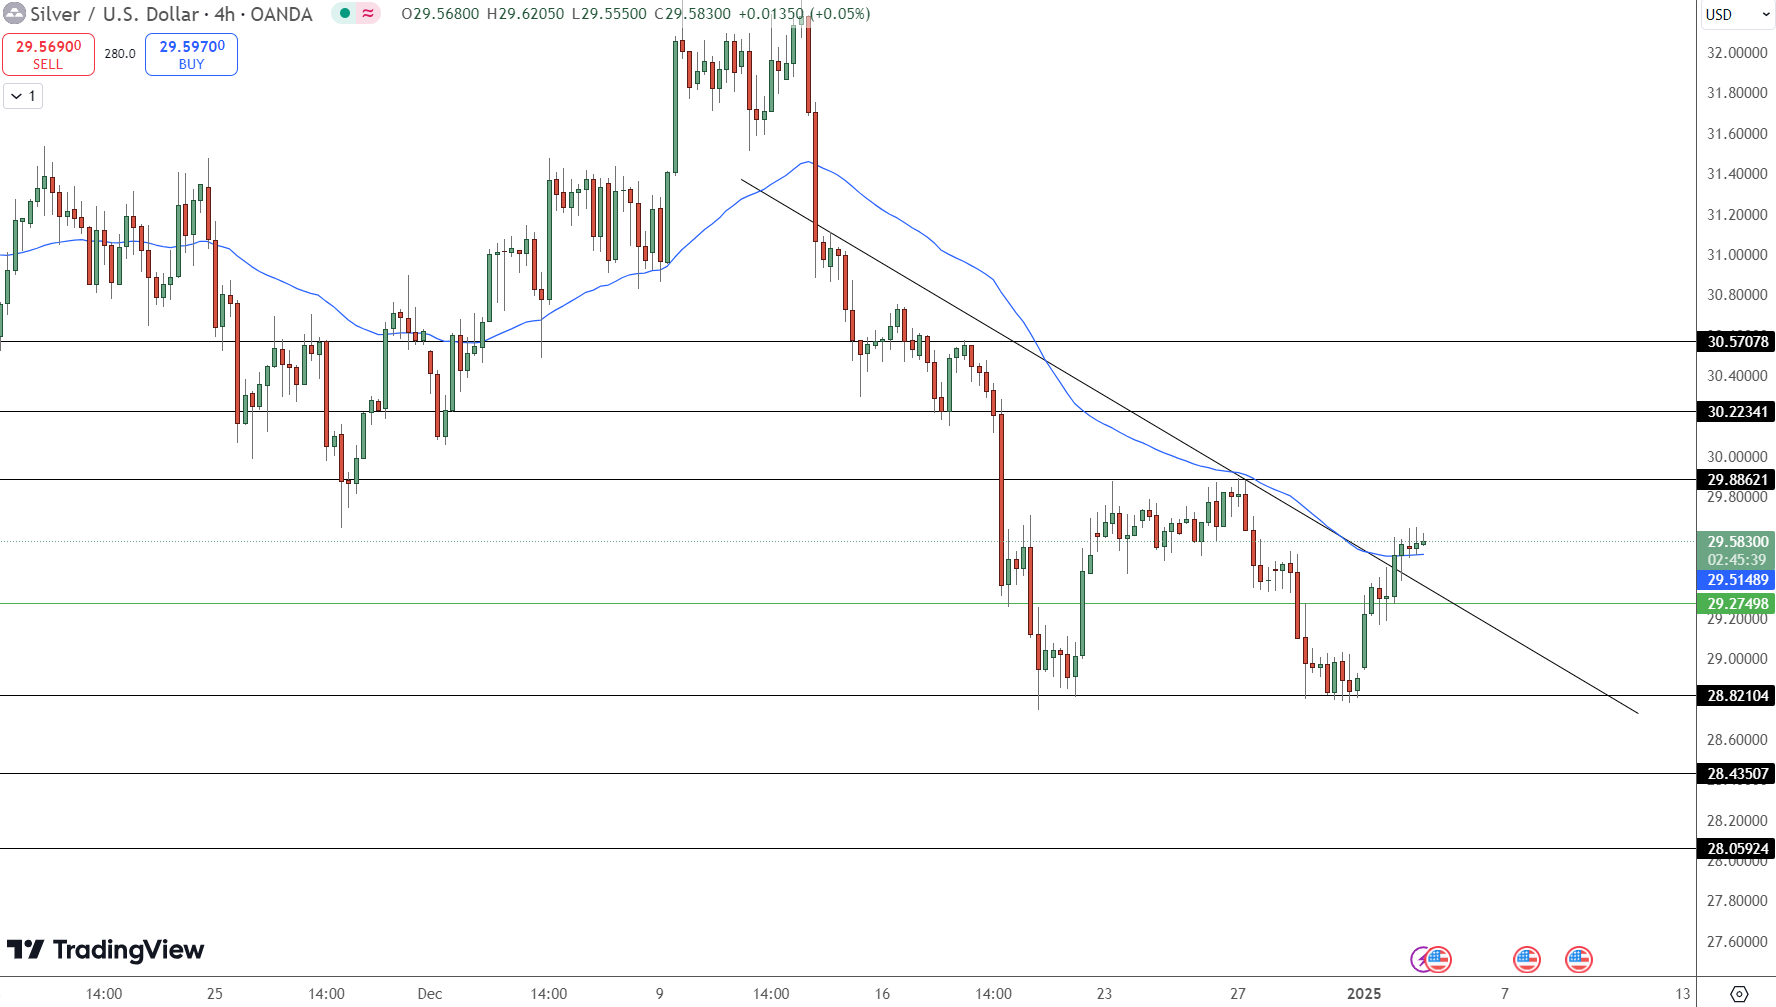
A decisive move above $29.88 could attract additional buying interest, paving the way toward the $30.43 level. Conversely, a drop below $29.34 may trigger selling pressure, with $28.78 acting as the first line of defense.
Broader Market Factors Supporting Silver
Silver’s rise is underpinned by multiple macroeconomic and geopolitical factors. Record central bank gold purchases are creating a supportive environment for precious metals, and a recovering Chinese economy could further drive demand. Additionally, subdued U.S. Treasury yields—at 4.24% for the 2-year and 4.56% for the 10-year—enhance silver’s appeal as a non-yielding asset.
- Check out our free forex signals
- Follow the top economic events on FX Leaders economic calendar
- Trade better, discover more Forex Trading Strategies
- Open a FREE Trading Account
- Read our latest reviews on: Avatrade, Exness, HFM and XM
Related Articles


Sidebar rates
Related Posts
