Tesla Stock Faces Correction After Hitting $488 All-Time High

Tesla (TSLA) Stock Targets Major Fib Support After Recent Surge
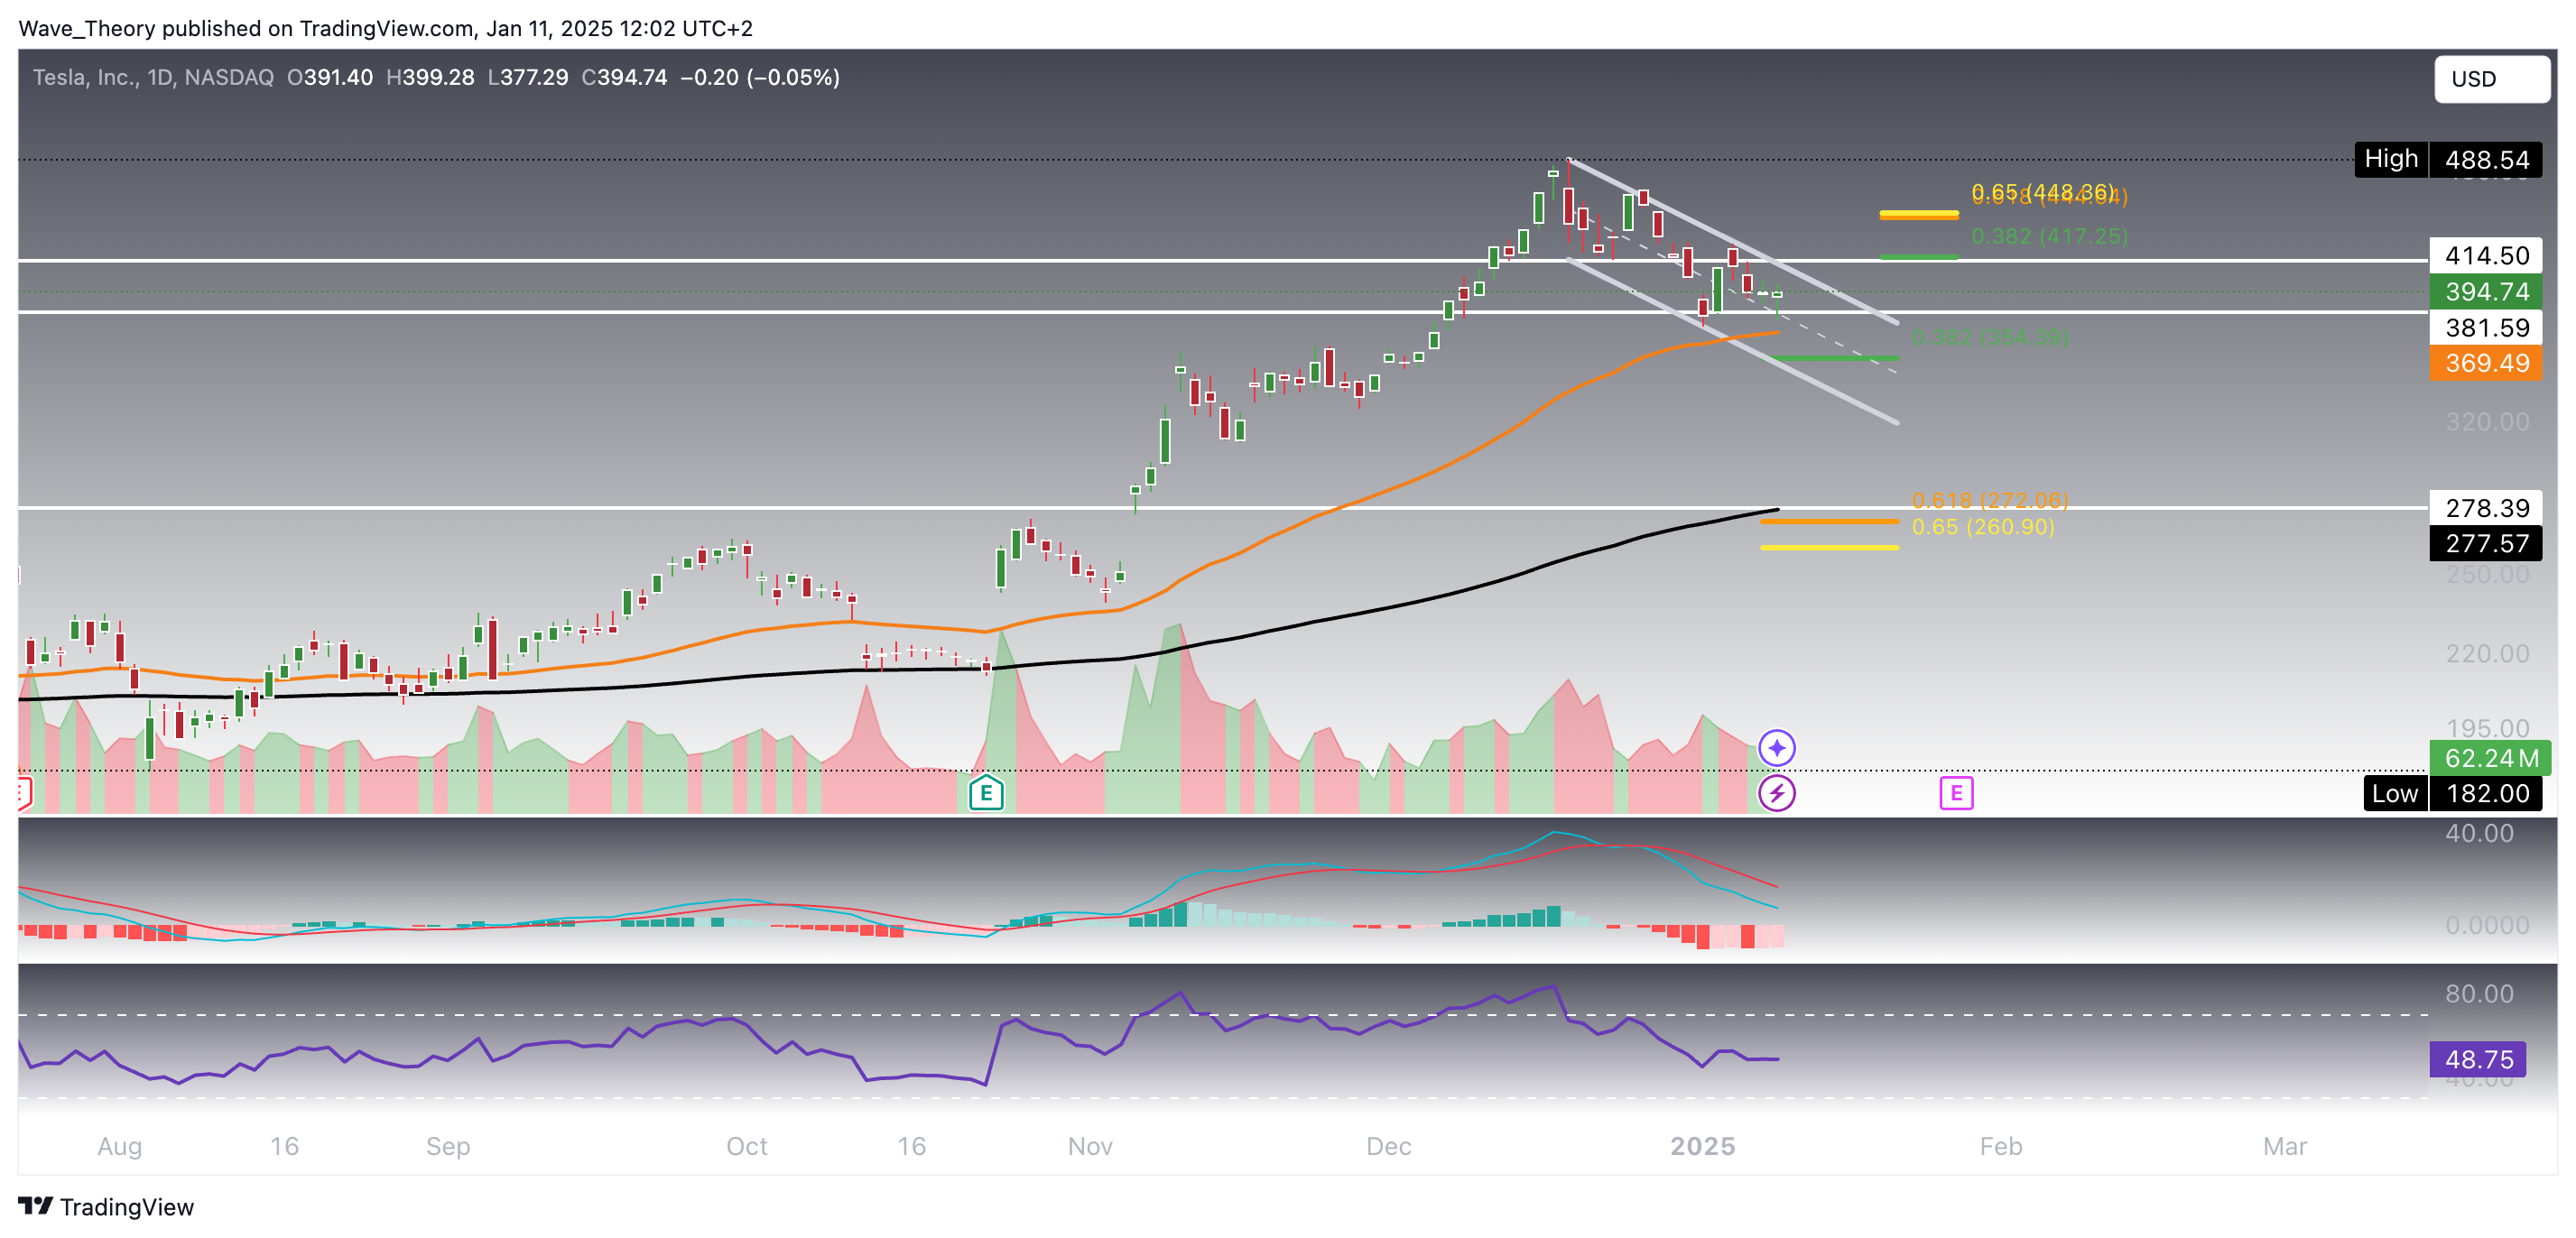
Tesla stock has enjoyed a robust rise over the past few months, but it is currently undergoing a correction within a parallel downward channel. The stock now finds itself at a critical support zone in the previous resistance area between $381.6 and $414.5. If TSLA breaks this level to the downside, it could correct further toward the 50-day EMA at $369.5 or the 0.382 Fibonacci support at $354.4, where it may potentially bounce off bullishly, initiating a recovery toward the next key Fibonacci resistances at $417.25 and $448.
Should Tesla break these Fib supports, the stock could retrace further down to the golden ratio support at $265, with the 200-day EMA acting as additional support at $277.6. Meanwhile, the daily chart indicators are giving mixed signals. The RSI is neutral, the EMAs still confirm a bullish trend in the short to medium term with a golden crossover, while the MACD lines are crossed bearishly. However, the MACD histogram has been ticking bullishly higher since Friday, signaling potential for a shift in momentum.
Will Tesla Stock’s Trend Remain Bullish?
In simple terms, Tesla needs to stay above the golden ratio support at $260 to maintain its bullish trend. To fully overcome the ongoing correction, it must break through the golden ratio resistance at $445.
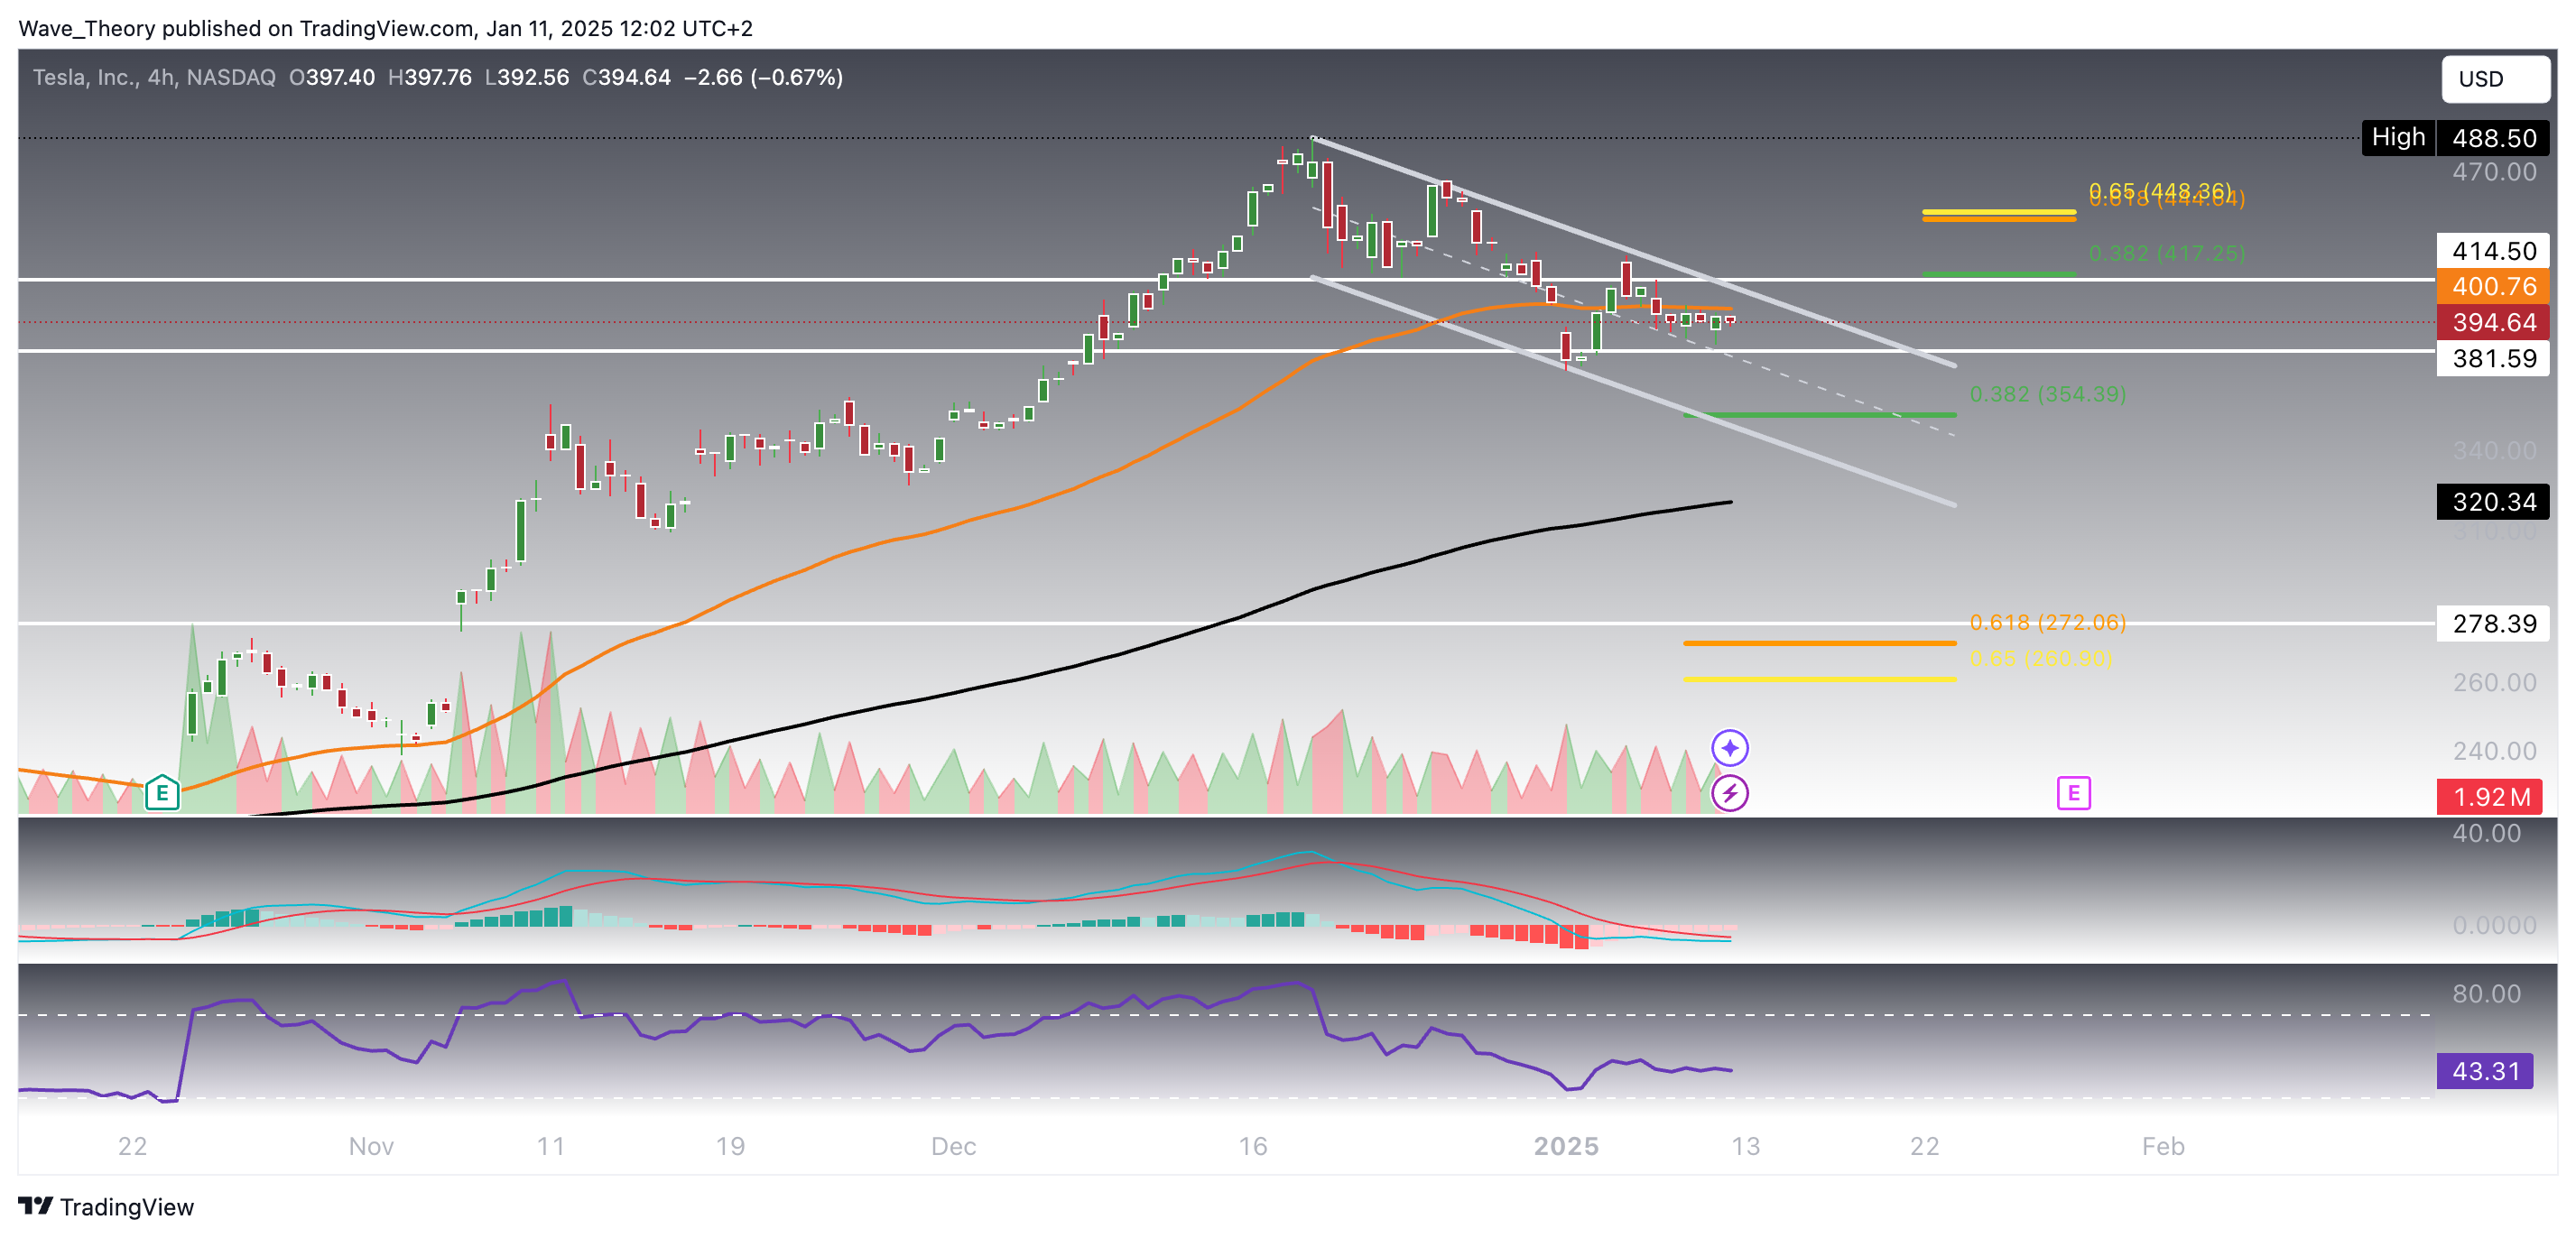
On the 4H chart, the indicators lean more towards a bullish outlook. The EMAs still show a golden crossover, confirming the short-term bullish trend. Although the MACD lines haven’t crossed bullishly yet, the histogram has been showing consistent bullish ticks, and the RSI is sitting in neutral territory, indicating that momentum could shift upwards.
Weekly Chart: Weakening Bullish Momentum On The MACD Histogram
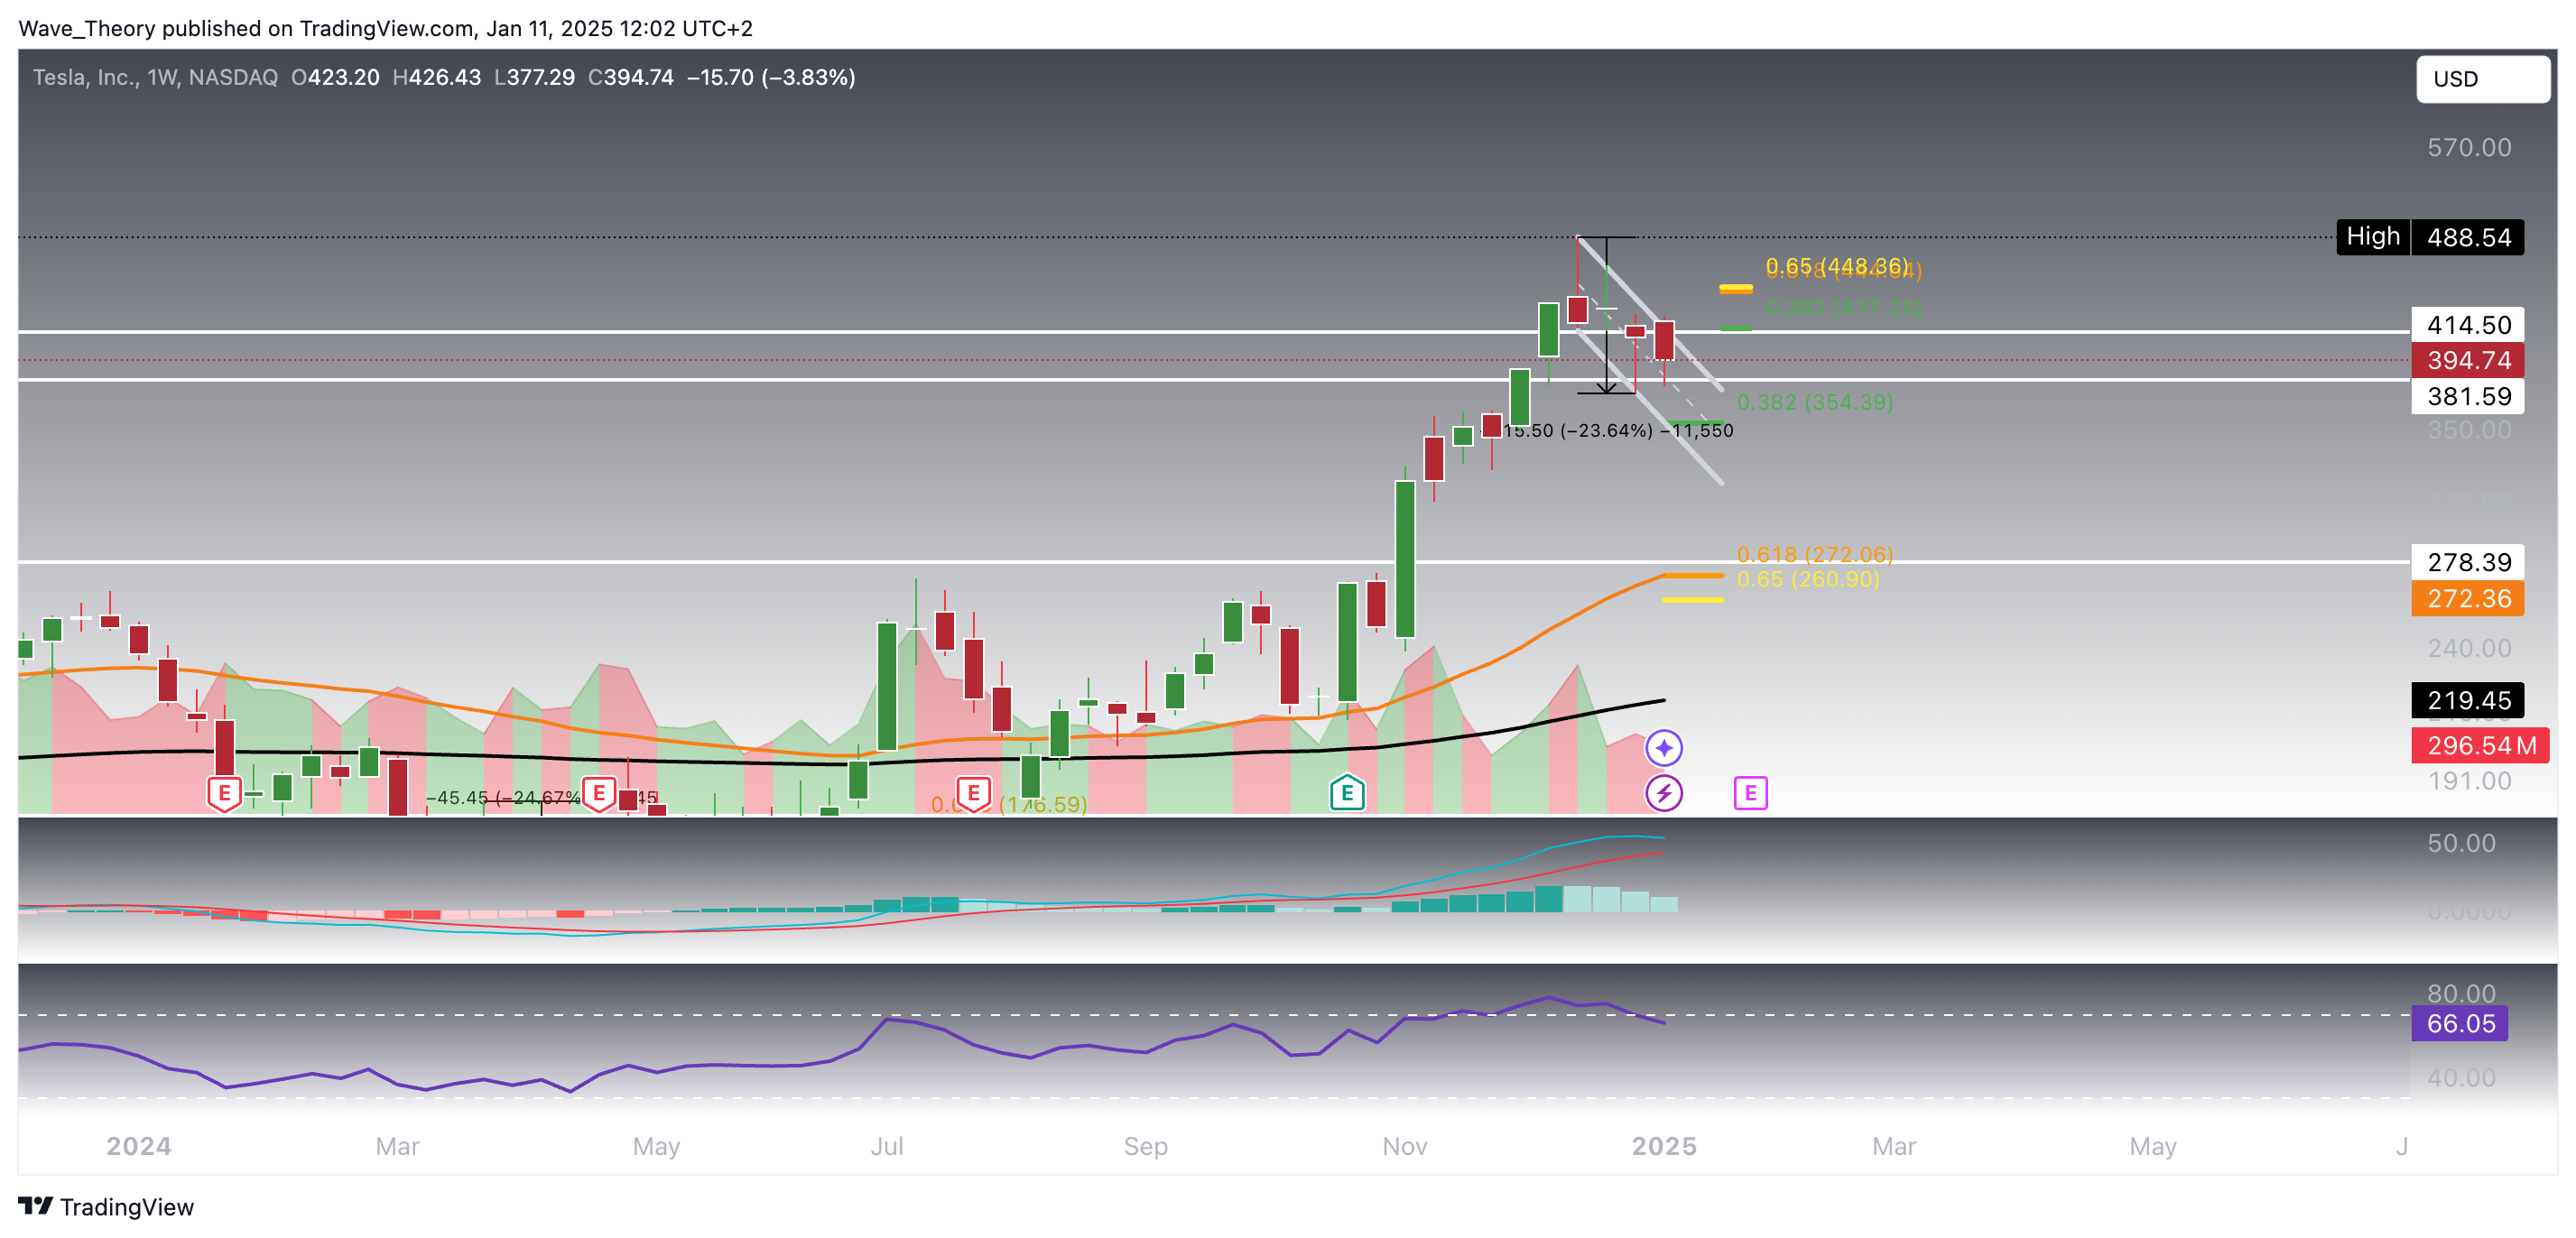
On the weekly chart, it’s clear that Tesla has undergone a correction of over 23.6% in the past few weeks. This decline has led the MACD histogram to tick bearishly lower for the past four consecutive weeks. Despite this, the MACD lines remain bullishly crossed, and the RSI has entered neutral territory after previously being in overbought regions. Additionally, the EMAs continue to show a golden crossover, confirming the bullish trend in the medium term.
If TSLA holds above its current support zone, it could signal a major upward move in the near future.
Tesla Stock Trend Remains Bullish: Mid-Term Outlook Still Positive
- Check out our free forex signals
- Follow the top economic events on FX Leaders economic calendar
- Trade better, discover more Forex Trading Strategies
- Open a FREE Trading Account
- Read our latest reviews on: Avatrade, Exness, HFM and XM
Related Articles


Sidebar rates
Related Posts
