Gold Hits $2,690: Bullish Trend Holds as Inflation Data Sparks Fed Debate
Gold prices edged lower on Monday, trading at $2,690.74, as the stronger-than-expected U.S. December jobs report reinforced...

Gold prices edged lower on Monday, trading at $2,690.74, as the stronger-than-expected U.S. December jobs report reinforced the Federal Reserve’s cautious stance on rate cuts.

The robust nonfarm payrolls data, which showed an addition of 256,000 jobs versus the forecasted 160,000, highlighted the resilience of the U.S. economy, reducing the likelihood of significant rate cuts. This strengthened the U.S. dollar, making dollar-priced bullion more expensive for international buyers.
President-elect Donald Trump’s trade policies, including proposed tariff hikes on imports, are expected to stoke inflation further. While gold is often used as a hedge against inflation, higher interest rates reduce its appeal as a non-yielding asset. Traders now anticipate the Fed to pause rate cuts, with only one reduction expected in June, reflecting a significant shift in market sentiment.
Focus Shifts to U.S. Inflation Data and Fed Speeches
The upcoming release of U.S. monthly inflation data is pivotal for gold’s outlook. Analysts are closely monitoring these figures for signs of any economic slowdown that could curb the dollar’s strength and lift hopes for further Fed rate cuts. Additionally, speeches from key Fed officials this week may provide insights into the central bank’s strategy, adding another layer of market-moving potential.
“After a very strong December jobs report, we think the cutting cycle is over,” BofA Global Research noted. With the Fed showing little urgency to ease further, gold could face additional headwinds, especially if the dollar and Treasury yields continue to rise.
Daily Technical Outlook: XAU/USD – January 13, 2025
Gold remains in a bullish trend on the 2-hour chart, supported by an upward channel. Immediate support is seen at $2,681 (pivot point), with additional levels at $2,666.33 (50 EMA) and $2,649.79. On the upside, key resistance levels lie at $2,697.80, $2,709.95, and the critical psychological mark of $2,721.30.
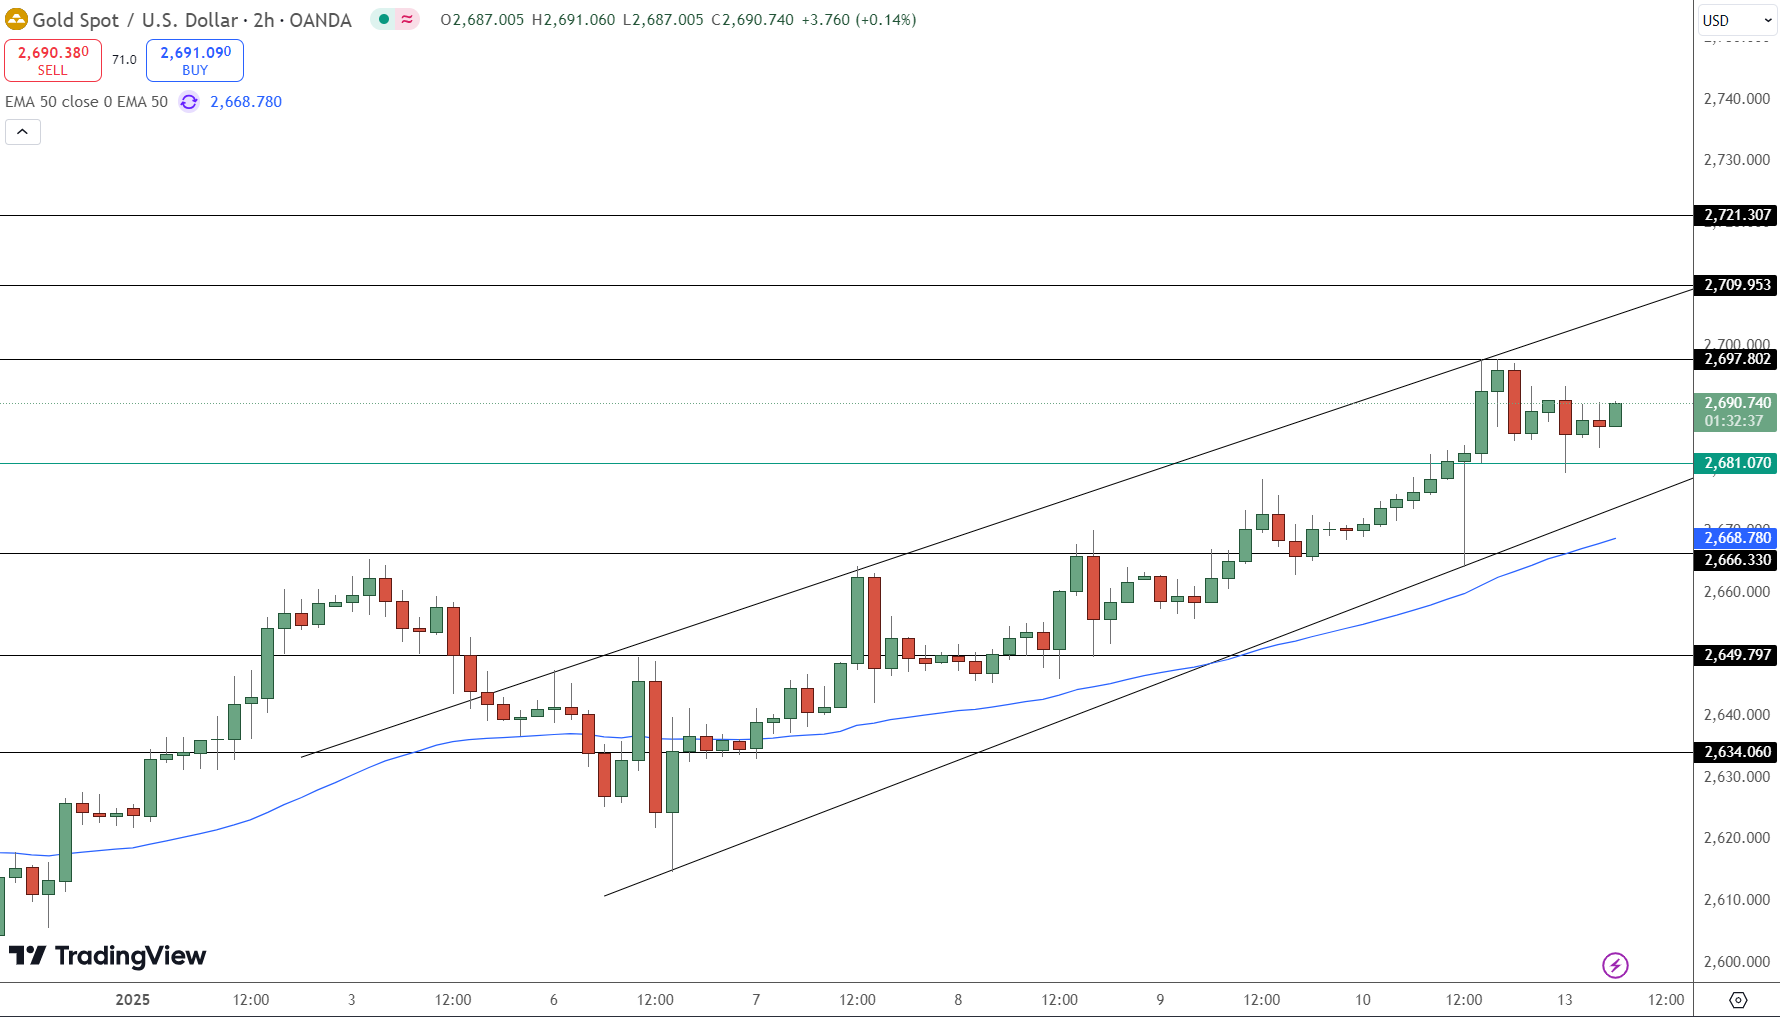
The 50 EMA at $2,668.78 is acting as dynamic support, reinforcing the bullish momentum. Technical indicators like the RSI suggest neutral momentum, indicating that gold has room to rise further if it holds above the $2,681 support level. A sustained breakout above $2,697 could accelerate gains, targeting higher resistance zones. Conversely, a fall below $2,681 could signal a trend reversal.
Key Insights:
-
Resistance Levels: $2,697.80, $2,709.95, $2,721.30.
-
Support Levels: $2,681, $2,666.33 (50 EMA), $2,649.79.
-
Trend: Bullish within an upward channel; watch $2,681 pivot.
- Check out our free forex signals
- Follow the top economic events on FX Leaders economic calendar
- Trade better, discover more Forex Trading Strategies
- Open a FREE Trading Account
- Read our latest reviews on: Avatrade, Exness, HFM and XM
Related Articles


Sidebar rates
Related Posts
