Dogecoin Faces Critical Test at $0.3750 Resistance Level After 11% Rally
Recent price action shows Dogecoin (DOGE) consolidating in a significant trading range, with technical indicators pointing to key levels
Recent price action shows Dogecoin (DOGE) consolidating in a significant trading range, with technical indicators pointing to key levels that traders are watching closely.
DOGE/USD has been displaying notable volatility while maintaining its position as one of the most-watched digital assets in the market.
Dogecoin Price Analysis
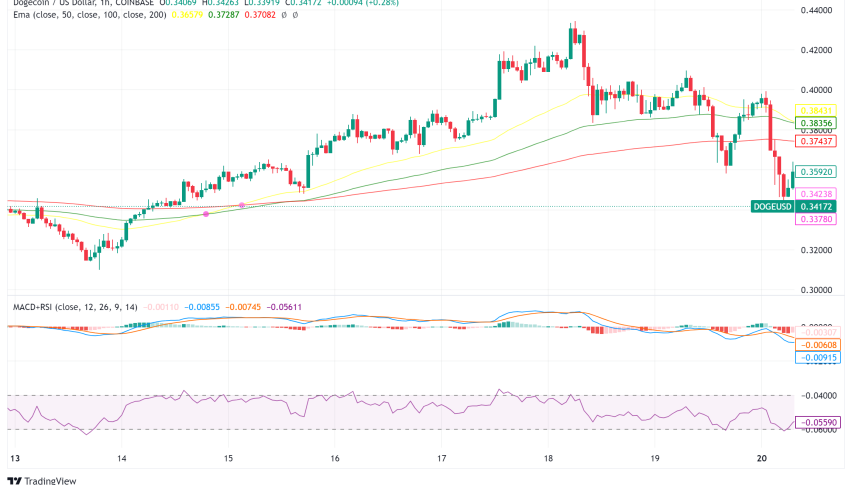
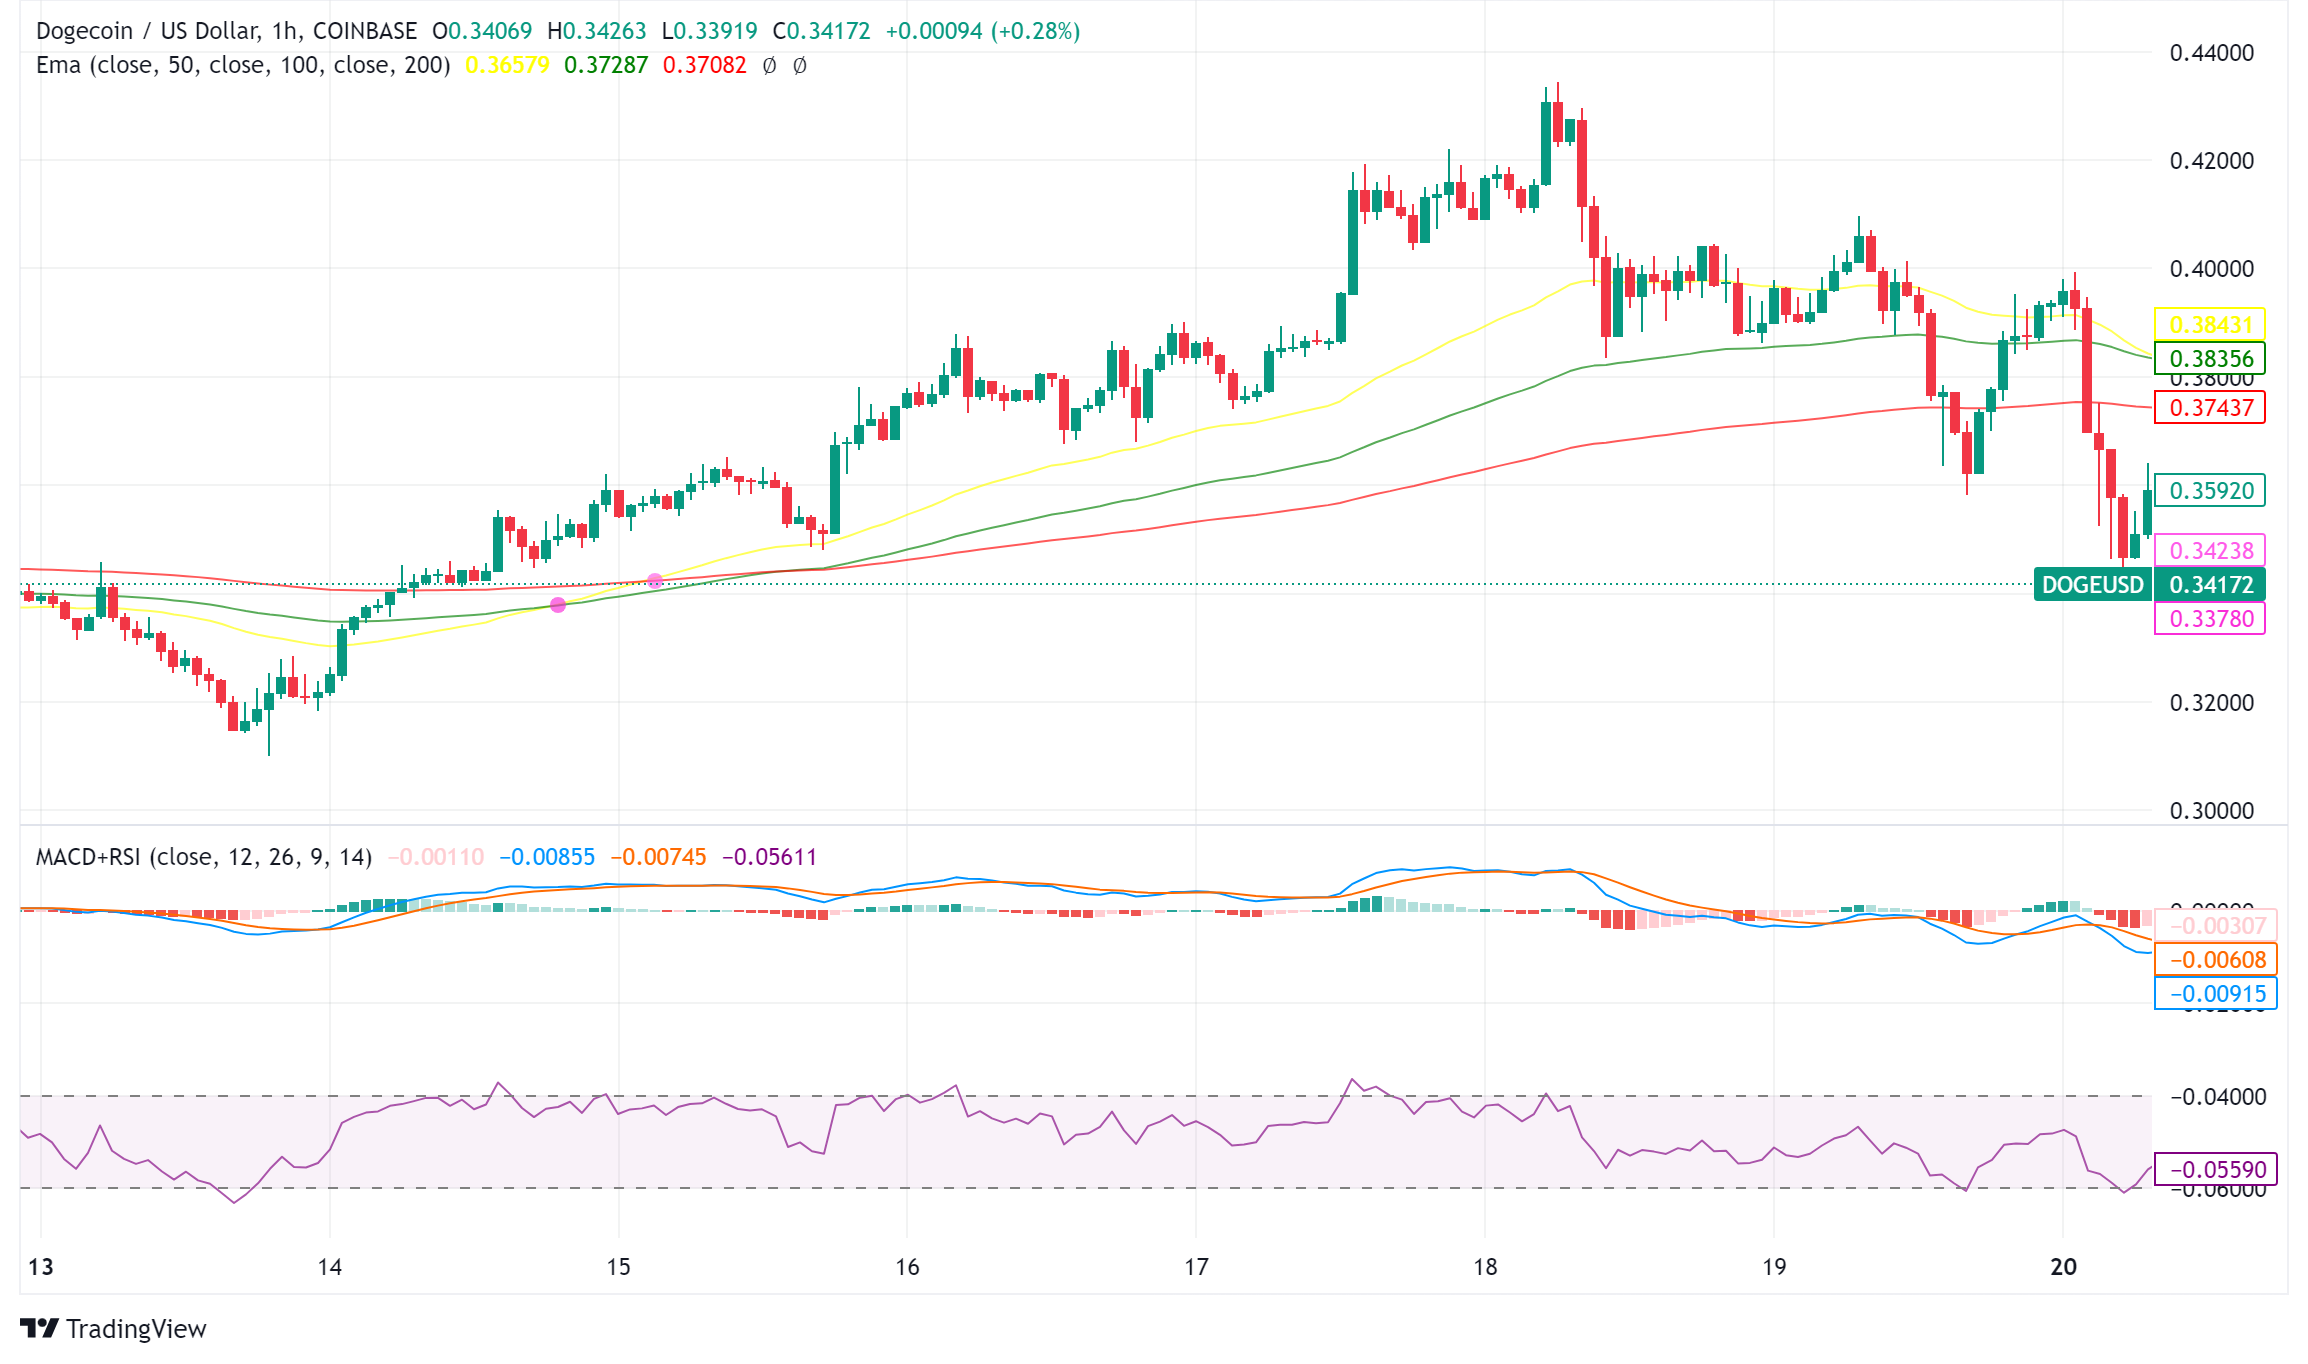
Having seen an 11% increase in recent trading sessions, DOGE is now trading around $0.38. Technical study exposes numerous important pricing levels that might affect near-term price behavior:
- Immediate resistance: $0.3680
- Key resistance level: $0.3750
- Critical support: $0.3380
- Secondary support: $0.3250
The asset shows some near-term bearish pressure since its trading below its 100-hour simple moving average. On the hourly chart, a noteworthy bearish trend line has developed with resistance around $0.3650.
DOGE/USD Technical Analysis
The present technical setup displays mixed signals:
- The MACD (Moving Average Convergence Divergence) indicator is showing momentum in the bearish zone
- The Relative Strength Index (RSI) is trading below the 50 level, indicating moderate selling pressure
- Price action is forming a consolidation pattern below key resistance levels
Short-Term Dogecoin Price Prediction
For bullish continuation, DOGE needs to clear several technical hurdles:
- Break above the immediate resistance at $0.3680
- Successful close above the $0.3750 level
- Maintain support above $0.3380 to prevent further downside
Failure to maintain these levels could lead to a retest of lower support zones, potentially reaching the $0.3250 area.
- Check out our free forex signals
- Follow the top economic events on FX Leaders economic calendar
- Trade better, discover more Forex Trading Strategies
- Open a FREE Trading Account
- Read our latest reviews on: Avatrade, Exness, HFM and XM
Related Articles


Sidebar rates
Related Posts
