JSE All Share Index Gains 547 Points Amid Trade Fears, Rand Weakness
The JSE FTSE All Share Index rose 546.65 points (+0.55%) to 99,243.04 ZAR on Tuesday, defying broader trade and currency concerns.
Quick overview
- The JSE FTSE All Share Index increased by 546.65 points (+0.55%) to 99,243.04 ZAR, despite concerns over trade and currency.
- Investors are awaiting the August 1 deadline for a potential 30% US tariff on South African exports, which could impact trade terms.
- The rand is under pressure ahead of the SARB's decision on interest rates, with expectations of a 25 basis point cut to stimulate growth.
- The JSE Top 40 Index is consolidating in a bullish trend, testing resistance levels while traders watch for potential breakouts.
The JSE FTSE All Share Index rose 546.65 points (+0.55%) to 99,243.04 ZAR on Tuesday, defying broader trade and currency concerns. Gains were broad-based across large caps as the rand weakened ahead of a key announcement and looming tariffs.
Investors are waiting for the August 1 deadline for a 30% US tariff on South African exports. ETM Analytics noted that the lack of clarity is still weighing on the currency, saying: “It may be that the announcement is only made on Friday, which may help clarify SA’s trade position with the US.” If talks fail, SA may get less favourable trade terms, which will impact export sectors.
Rand Under Pressure Ahead of Central Bank Decision
The rand weakened in early trade, dragged by global trade fears and Thursday’s SARB decision. A Reuters poll of economists expects a 25 basis point cut to stimulate credit and growth. June’s M3 money supply rose 7.27% y/y (vs 6.86% in May) and private sector credit was steady at 4.98%.
Nedbank analysts say “lower interest rates and improving household finances” are driving domestic lending. But bond markets are cautious, with the 2035 yield up 2.5 basis points to 9.825%.
JSE Top 40 Index Technical View: Index Consolidates in Bullish Zone
The JSE Top 40 Index is testing the resistance zone near 91,800, which is the 23.6% Fibonacci retracement from the recent high of 92,783.2. The index has respected its trendline and is above the 50-period SMA (90,462), so bullish momentum is intact.
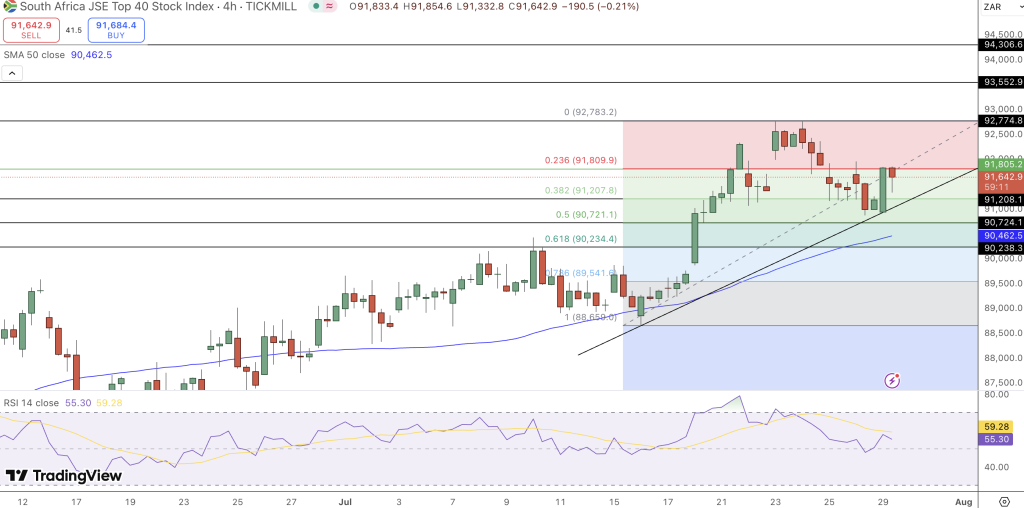
The RSI is at 54.90, which is neutral, so there’s room for more upside if buyers regain strength. A close above 91,800 could trigger a move to 92,774 and 93,552, while a drop below 91,208 could see supports at 90,234 and 89,541. Price is consolidating in a bullish trend, so traders may look for breakouts or dips to the Fibonacci levels to get back in.
Equities are short-term strong but:
- August 1 US-SA trade deadline
- Thursday SARB decision
- Credit and growth trajectory
If talks fail or SARB disappoints, volatility will return and hit equities. For now, it’s okay.
- Check out our free forex signals
- Follow the top economic events on FX Leaders economic calendar
- Trade better, discover more Forex Trading Strategies
- Open a FREE Trading Account
- Read our latest reviews on: Avatrade, Exness, HFM and XM
Related Articles
Sidebar rates
Related Posts
