Meta (META) Stock Analysis — May 6, 2026: $605 Falling Wedge Gains Trade Truce Catalyst — $650 Gap Fill in Play
META closed at $604.96 on May 5, down 0.89% in a quiet session — then the US-China 90-day tariff truce dropped over the weekend...
Quick overview
- META closed at $604.96 on May 5, but surged 7.9% on Monday following a US-China tariff truce, which is expected to stabilize ad revenue from Chinese advertisers.
- The falling wedge pattern in META's stock chart suggests a potential breakout, with a target of $650 for gap fill.
- Analysts maintain a positive outlook with a consensus price target of $839.87, indicating a 39% upside from the recent close.
- Despite the positive developments, concerns about user growth stagnation and ongoing capex commitments remain key issues for META.
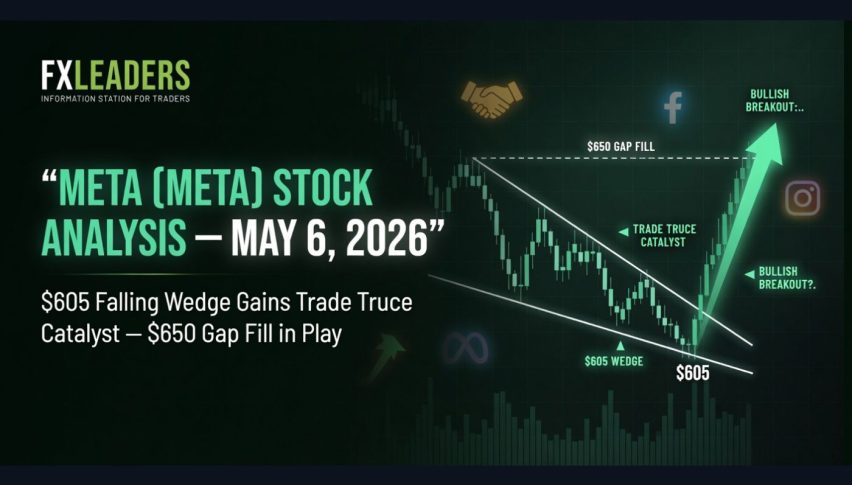
META closed at $604.96 on May 5, down 0.89% in a quiet session — then the US-China 90-day tariff truce dropped over the weekend, sending Meta surging 7.9% in Monday trading to lead the Magnificent Seven recovery. The falling wedge structure that has been squeezing in since that $742 high now finally has the catalyst it needed to bust out. The $650 gap fill is right there as the immediate target.
The Trade Truce Is Bulls for Meta – Here’s Why
Well, the Chinese advertisers are a big deal for Meta – they account for roughly 11% of all the ad dollars spent on the platform. And that revenue stream had been in danger due to the escalating tariffs that followed Trump’s announcement back in April 2. So when the 90-day tariff pause kicks in – slashing tariffs on Chinese goods from 145% down to 30% – it basically removes the biggest risk to Meta’s ad revenue guidance for Q2.
Meta’s Q2 guidance was for $58-61 billion in revenue, implying 25% year-over-year growth at the midpoint, which was already a deceleration from Q1’s 33% growth rate. But now with Chinese advertiser spending stabilised rather than contracting, the chances of hitting that $61 billion ceiling in Q2 just got a whole lot higher. Mark Mahaney at Evercore ISI is still calling for an Outperform with a $900 target, citing improvements in AI ad ranking and Reels monetization as the structural advantages that make Meta’s ads stand out – no matter what the broader macro environment is like.
The analyst consensus as of May 5 is $839.87 across 38 analysts all giving a Buy rating – that implies a 39% upside from the $604.96 close. And the trade truce doesn’t change the $145 billion capex debate, but it certainly removes a key risk that was putting pressure on the stock after its last earnings report.
One thing that’s worth keeping in mind from Q1 is that daily active users across Meta’s apps came in at 3.56 billion – that’s a 4% rise year-over-year, but a 5% sequential drop from Q4 – and that’s something Meta attributed to seasonal factors and changes in how they measure users. Long term, that kind of user growth stagnation at scale is one of the big structural questions that Meta still needs to answer – and one that advertising pricing power needs to compensate for.
META Technical Analysis – The Falling Wedge Pattern is Getting Ready to Break
The daily chart shows Meta stuck right on the lower boundary of that falling wedge from the $742 high. The pattern has been compressing and tightening since February – and falling wedges usually resolve in a pretty big way when the right catalyst comes along.
The $604.96 close hit horizontal support at $600.70 – that’s the bottom of the gap left by the post-earnings selloff. That gap runs from $600.70 right up to $635.59, with the top of the gap at $650.34 as the first target. The red moving average is capping the immediate recovery at around $635-$650.
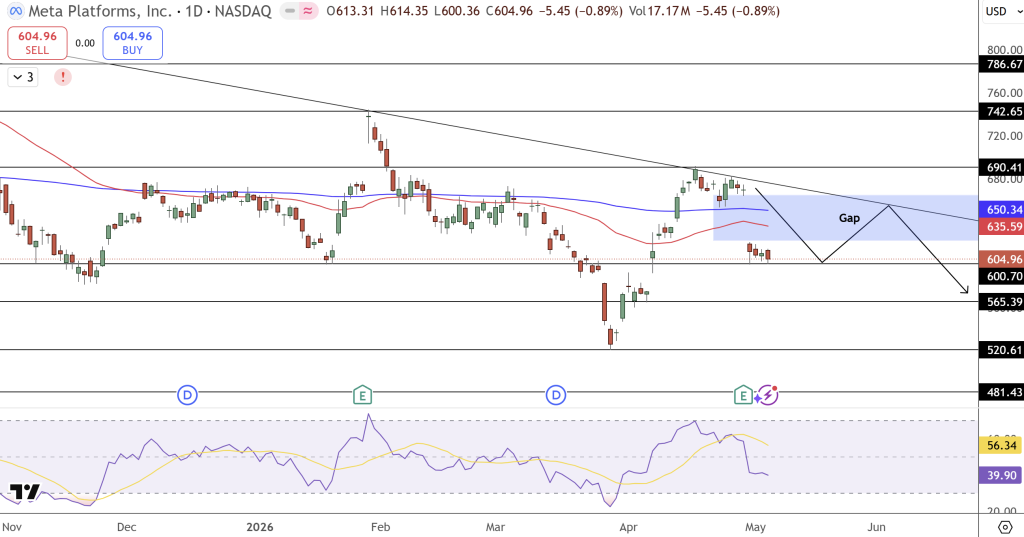
Support: $600.70 (trendline / gap bottom) → $580 → $565 (deeper wedge support) comes into play if things keep moving down.
Resistance: $620 → $635.59 (middle of the gap) → $650.34 (gap top / MA) → $700+ is the place to look for a bounce.
The RSI is right around 56 which is neutral, having cooled off from recent highs without any bearish divergence. The trade truce surge is the external push the wedge needed to put the pressure on the upper boundary.
Trade setup: Long above $620 close | Target $650 gap fill | Stop below $600.
FAQ: META — Trade Truce Impact, $650 Target, and Capex Debate
How does the US-China trade truce affect Meta’s revenue?
Chinese advertisers represent approximately 11% of Meta’s total ad spend. The 90-day tariff reduction from 145% to 30% stabilises that revenue stream and increases the probability of Q2 guidance being met at the upper end of the $58–61 billion range. It does not resolve the capex debate — the $125–145 billion 2026 spending commitment remains unchanged — but removes the revenue-side risk that had been compounding the post-earnings pressure.
What is the $650 resistance on the Meta chart?
$650.34 is the top of the visible gap left by the April 29 post-earnings drop. A gap fill is the technical term for price recovering to close the unfilled range between $600.70 and $650.34. The red moving average sits in the same zone at $635–$650, making it a double-resistance level. A confirmed daily close above $650 would neutralise the falling wedge’s downward pressure and open the path toward $700.
What is the Meta stock price target for 2026?
38 analysts maintain a Buy consensus with a $839.87 average price target — 39% upside from the May 5 close. The base case scenario, per MEXC’s analysis, requires revenue growth normalising to the low 20s through H2 with capex stable and ad pricing power sustained. 24/7 Wall St. targets $882.71. Evercore ISI and Bernstein both maintain $900 targets. The Q2 earnings in late July and any Superintelligence Labs product announcement are the next re-rating catalysts.
- Check out our free forex signals
- Follow the top economic events on FX Leaders economic calendar
- Trade better, discover more Forex Trading Strategies
- Open a FREE Trading Account
- Read our latest reviews on: Avatrade, Exness, HFM and XM

Related Articles

Sidebar rates

Related Posts
 Save
SaveAva
