Meta Platforms (META) Stock: Down 28% From Record High

Quick overview
- Meta Platforms has seen a significant decline of approximately 28% from its all-time high of $796.25, with recent selling pressure intensifying.
- The company's latest earnings report showed strong revenue growth, but raised capital expenditure guidance has raised concerns among investors.
- Technical indicators across multiple timeframes confirm a bearish trend, with critical support levels between $500 and $526 that must hold to avoid further declines.
- A decisive break below these support levels could lead to a deeper retracement, while a recovery above $600 is necessary to neutralize the current bearish structure.
Meta Platforms has gone from market darling to one of the most closely watched breakdowns in big tech. After printing an all-time high of $796.25, the stock has shed roughly 28% of its value, with selling pressure accelerating sharply in recent weeks. June alone has carved 11.2% off the share price, and the decisive break below the $581.25 support level this week has shifted the technical narrative from “healthy correction” to a trend that bulls are visibly losing control of.
Meta Platforms Earnings Report
Meta’s most recent earnings report landed on April 29, 2026, and on paper, it was strong. Q1 2026 revenue came in at $56.31 billion, up 33% year-over-year and beating consensus by 1.4%. Headline GAAP EPS of $10.44 crushed the $6.66 estimate — though an $8.03 billion one-time tax benefit inflated the figure. Stripped of that benefit, underlying EPS of roughly $7.31 still beat consensus by around 10%, with operating margin holding firm at 41%.
The problem wasn’t the quarter. It was the guidance: management raised 2026 capital expenditure guidance to $125–145 billion, up from $115–135 billion, signaling an even more aggressive AI infrastructure buildout. The market’s verdict was immediate – shares sold off after hours, and the stock has been unable to regain its footing since. The question hanging over the chart is no longer whether Meta can grow, but whether the market is willing to fund the spend at current multiples.
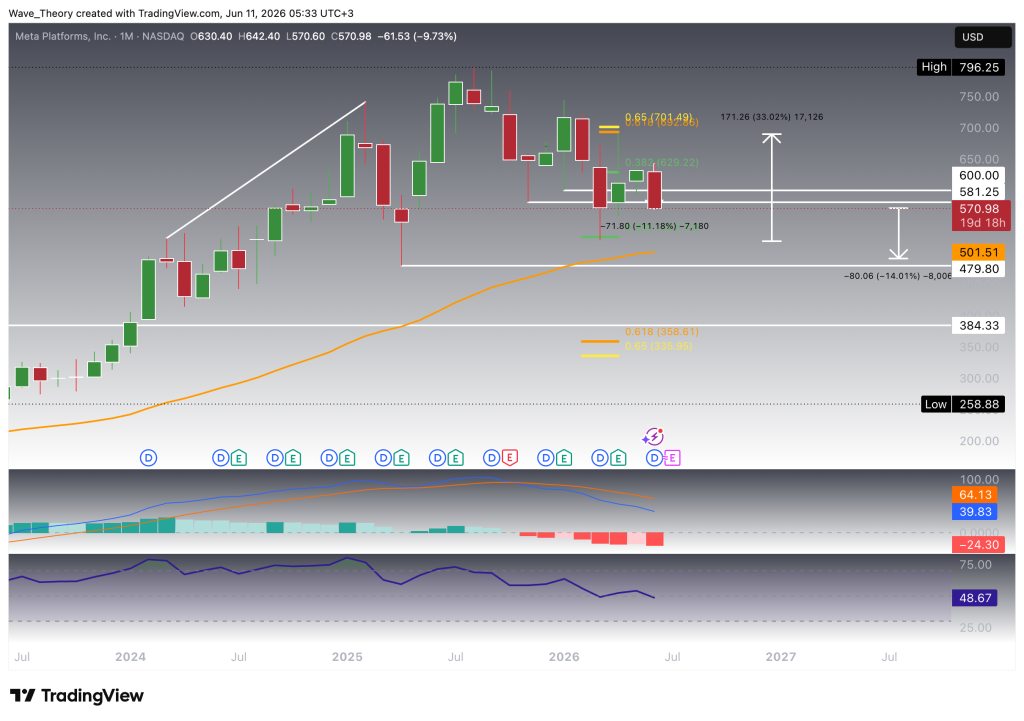
Nearly 30% Below the All-Time High
On the monthly chart, the deterioration is becoming difficult to dismiss. The MACD lines have rolled over into a bearish crossover, and the histogram has been printing progressively deeper red bars for several consecutive months – confirming that downside momentum is building rather than fading. The RSI has slipped below the 50 midline to 48.67 and continues to trend lower, though it remains far from oversold territory, leaving meaningful room for further downside before any mechanical bounce signal emerges.
Price could close below the $581.25 horizontal support this month, and the meta stock price could drop further toward the 50-month-EMA at $501.5 – an additional decline of roughly 14% from current levels. Before that, however, significant support lies at the 0.382 Fib level at $525.7, where META stock managed to bounce by 33% previously.
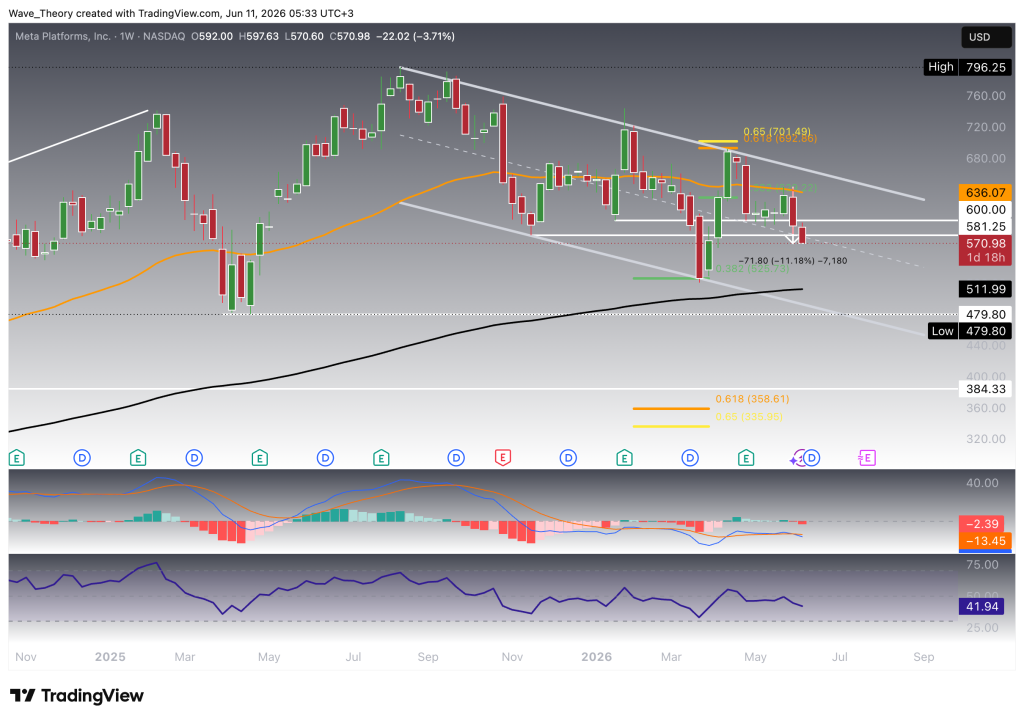
META Stock Breaks Below the $581 Support
The weekly chart tells the cleanest story: Meta has been trading inside a well-defined descending channel since topping out at $796.25, and every rally attempt has been rejected at or below the channel’s upper boundary. This week’s candle could decisively break the $581.25 support – a level that had held the structure together since the November panic low.
The stock now trades well below the 50-week moving average at $636.07, which has flipped into dynamic resistance. The MACD lines remain bearishly crossed and the RSI at 41.94 continues to grind lower without reaching oversold extremes – a configuration that historically accompanies trend continuation rather than reversal.
Should the selling pressure persist, the next significant demand zone emerges at the 0.382 Fibonacci retracement near $525.73, reinforced by the April swing low at $520.26. Below that, the 200-week exponential moving average at $512 and the 50-month exponential moving average at $501.51 complete a dense support cluster between $500 and $526 – the single most important technical region on the chart for the preservation of Meta’s long-term bullish structure. Should these levels fail to hold, META finds significant Fibonacci support at the golden ratio level at $350.
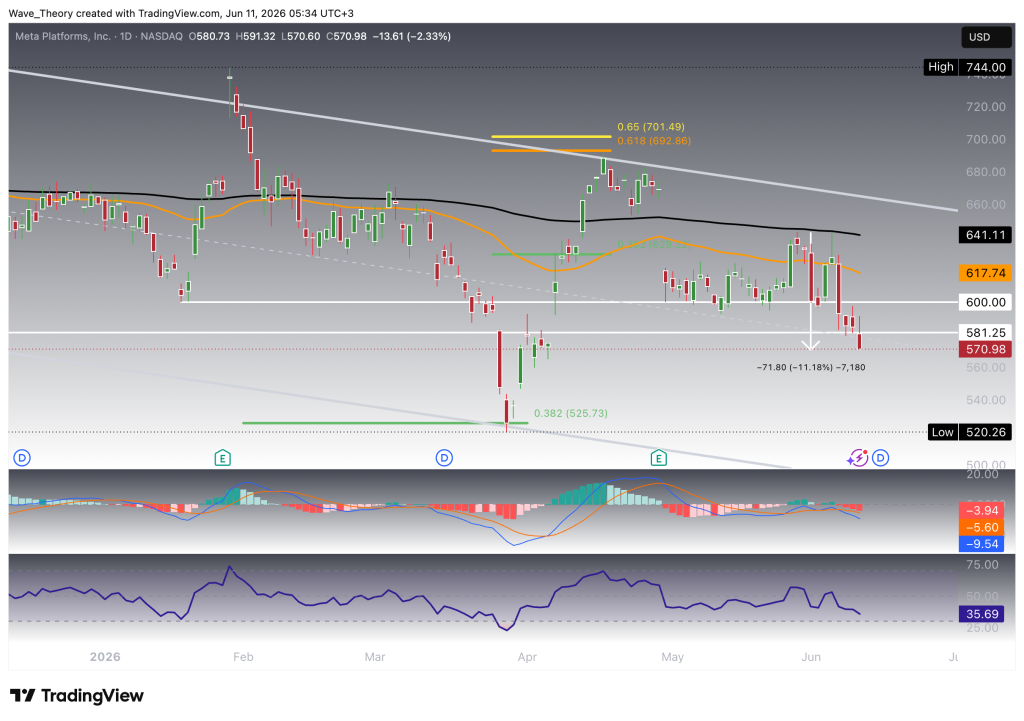
Death Cross Confirms the Bearish Shift on the Daily Chart
The daily chart removes any remaining ambiguity. The 50-day moving average at $617.74 has crossed below the 200-day moving average at $641.11, which confirms the trend bearishly in the short- to medium term. The price is trading firmly below both and seems to break the support zone between $581.25 and $600, confirming that the medium-term trend has flipped bearish.
The breakdown sequence has been methodical: first the loss of the $600 psychological level, then the break of $581.25 this week. The MACD remains bearishly crossed with the histogram printing red, while the RSI is approaching oversold territory, suggesting the decline may still have fuel before a meaningful relief bounce develops.
The measured move from the most recent breakdown projects a decline of roughly 9%, which aligns closely with the 0.382 Fib support level at $525.
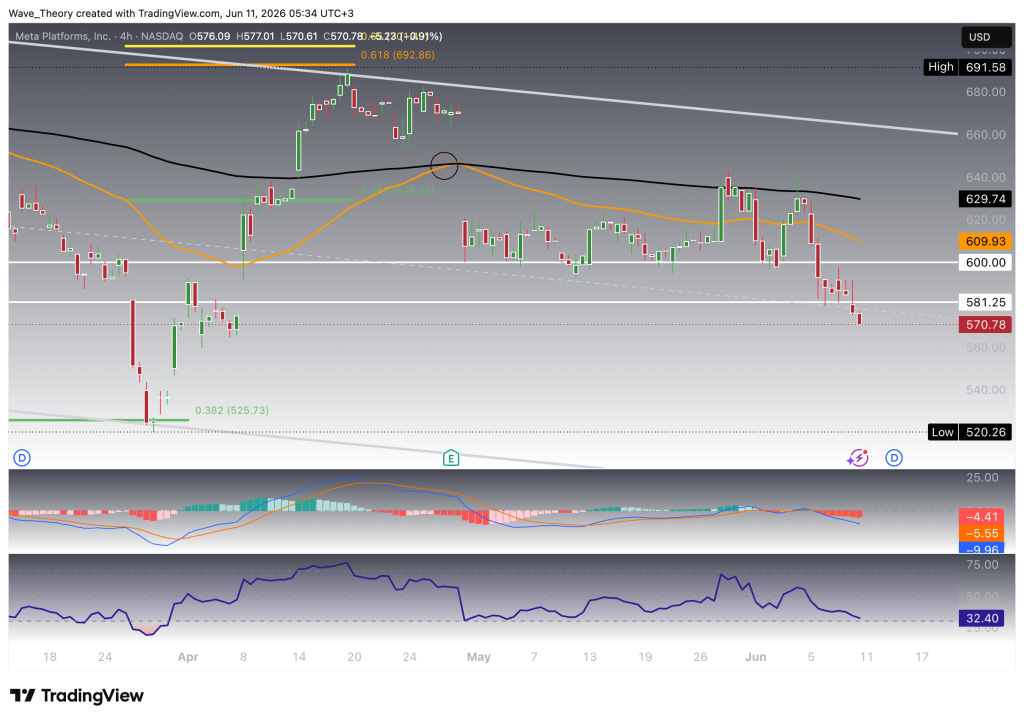
Similar Picture on the 4H Chart
The 4-hour chart paints a similarly bearish picture. The 50-period EMA at $609.93 remains firmly below the 200-period EMA at $629.74, confirming the short-term downtrend, while both averages continue to slope lower and cap every intraday recovery attempt.
The MACD lines remain bearishly crossed with the histogram stuck in negative territory, while the RSI has fallen to 32.40 – sitting just above the oversold threshold. This is the only timeframe approaching exhaustion readings, which may produce short-lived technical bounces, but rallies into the $581–600 region are likely to be treated as selling opportunities while the broader structure remains broken.
META Stock Analysis Summary & Key Levels
Meta Platforms (NASDAQ: META) has entered a confirmed corrective phase, falling roughly 28% from its all-time high and breaking below the critical $581.25 support this week. The technical structure is bearish across all analyzed timeframes: a death cross on the 4H and daily chart, a descending channel on the weekly, deepening negative MACD momentum on the monthly, and declining RSI readings everywhere — with only the 4H approaching oversold territory.
On the upside, the first resistance now sits at the broken $581.25 level, followed by the $600 psychological barrier, the 50-day moving average at $617.74, and the 0.382 Fibonacci retracement near $629.22, which coincides with the 200-period EMA on the 4H chart. A sustained reclaim of the $629–641 region would be the minimum requirement to neutralize the bearish structure.
To the downside, the key support cluster lies between $500 and $526, where the 0.382 Fibonacci retracement ($525.73), the April low ($520.26), the 200-week moving average ($511.99), and the 50-month moving average ($501.51) converge to form a major long-term demand zone. Below that, $479.80 marks the measured-move target from the monthly chart, with the deeper golden ratio support zone between $335 and $358 representing the last line of defense for the multi-year uptrend.
Overall, the path of least resistance remains to the downside while META trades below $600. The $500–526 support cluster is the zone bulls must defend — a decisive break below it would open the door to a far deeper retracement, while a strong reaction from that region could lay the foundation for the next sustained recovery attempt.
- Check out our free forex signals
- Follow the top economic events on FX Leaders economic calendar
- Trade better, discover more Forex Trading Strategies
- Open a FREE Trading Account
- Read our latest reviews on: Avatrade, Exness, HFM and XM
Related Articles


Sidebar rates
Related Posts
Ava

