Nike Stock (NKE) Price Prediction: Why Shares Crashed 77% From Its ATH

Quick overview
- Nike's stock has plummeted approximately 77% from its peak of $179.10, reflecting significant business deterioration.
- Key factors contributing to this decline include sliding revenue growth, high inventories, and increased competition from brands like On and Hoka.
- The upcoming Q4 earnings report on June 30 is critical, with analysts expecting EPS of $0.19 and revenue of $10.85B amid ongoing challenges in China.
- Technical indicators suggest a bearish trend, with potential support between $35 and $40, while resistance levels remain significantly higher.
Nike’s collapse from $179.10 to near $41 isn’t just a chart breaking down – it reflects real deterioration in the business. Sliding revenue growth, bloated inventories, heavy discounting that crushed margins, and lost ground to rivals like On and Hoka have all eroded the premium investors once paid for the stock. Slumping demand in China added further strain. As earnings power weakened, the market repriced Nike from a growth darling to a turnaround story, wiping out roughly 77% of its value. The charts below map where that repricing may find a floor.
Key Catalyst Ahead: Q4 Earnings on June 30
Nike reports fourth-quarter fiscal 2026 results on Tuesday, June 30, after the close – just days from now. That makes this a high-stakes setup, with the stock sitting directly on the $41.82 low ahead of a binary event. Analysts expect EPS near $0.19 on revenue of roughly $10.85B. The prior quarter actually beat expectations, yet the stock kept falling, a sign the market cares far more about forward guidance and margins than the headline print. Management has already flagged ongoing tariff pressure, a planned revenue pullback in Greater China, and a margin recovery that may not arrive until fiscal 2027. The technical implications are clear. A weak guide could break the $41.31 support and open fresh downside toward the $40.13 and $34.98 zones. Conversely, any upside surprise on margins or the turnaround narrative could spark a relief bounce toward the $44–$45 resistance band, where the 50-day-EMA waits. Either way, expect volatility.
Nike Collapses Below Golden Ratio Support as Long-Term Trend Breaks Down
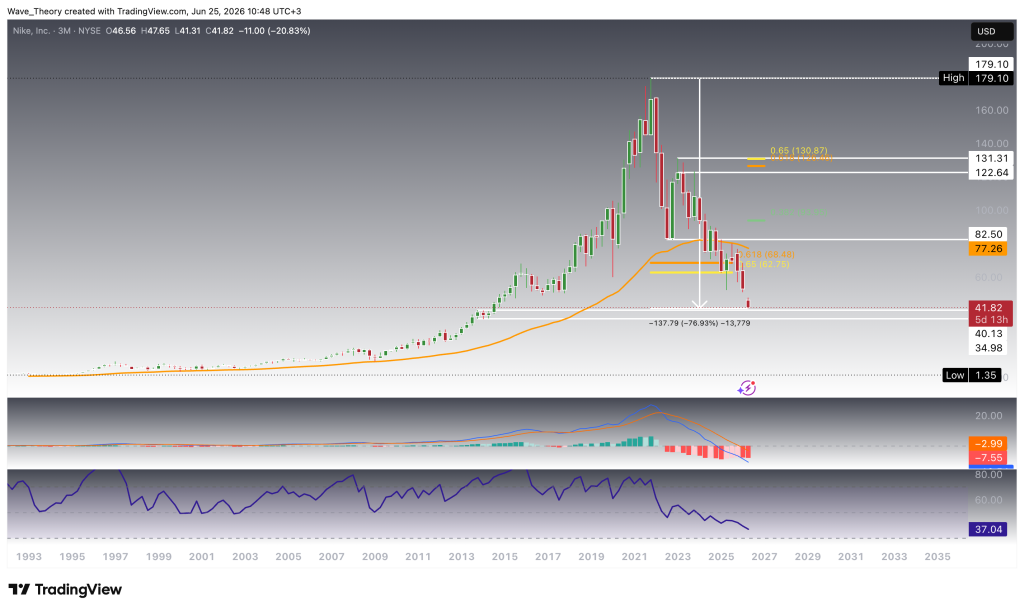
This is the quarterly (3M) chart, and the structure has decisively broken. Following its all-time high near $179.10, Nike entered a brutal correction that has erased $137.79, a decline of roughly 76.93%. The latest quarterly candle is devastating, dropping down 20.83% at $41.82 after opening at $46.56. Crucially, price has now lost the Golden Ratio support zone between $62.75 and $68.48, a level that should have anchored any recovery. That failure transforms the prior support into formidable overhead resistance. Above sit further Fibonacci barriers at the 0.382 level near $93.95, then the Golden Ratio resistance band between $126.46 and $130.87.
The decline has also sliced clean through the long-term exponential moving average, a structural event after decades of trend support. For the bullish thesis to even begin repairing, Nike would need to reclaim $62 and then challenge $82.50.On top of that, the 50-month-EMA acts as significant resistance at $77.3.
Until then, the path of least resistance remains lower. The quarterly indicators confirm the damage. The MACD lines are bearishly crossed and falling, printing −2.99 over −7.55, with the histogram deep in negative territory. The RSI has slumped to 37.04, approaching oversold but signalling persistent weakness rather than a turn. Momentum offers no evidence of a bottom yet.
That being said, Nike is about to hit historical support zone between $35 and $40. There, Nike stock price could find short-term relief and bounce back bullishly.
Weekly Death Cross Drags Price to Fresh Multi-Year Lows
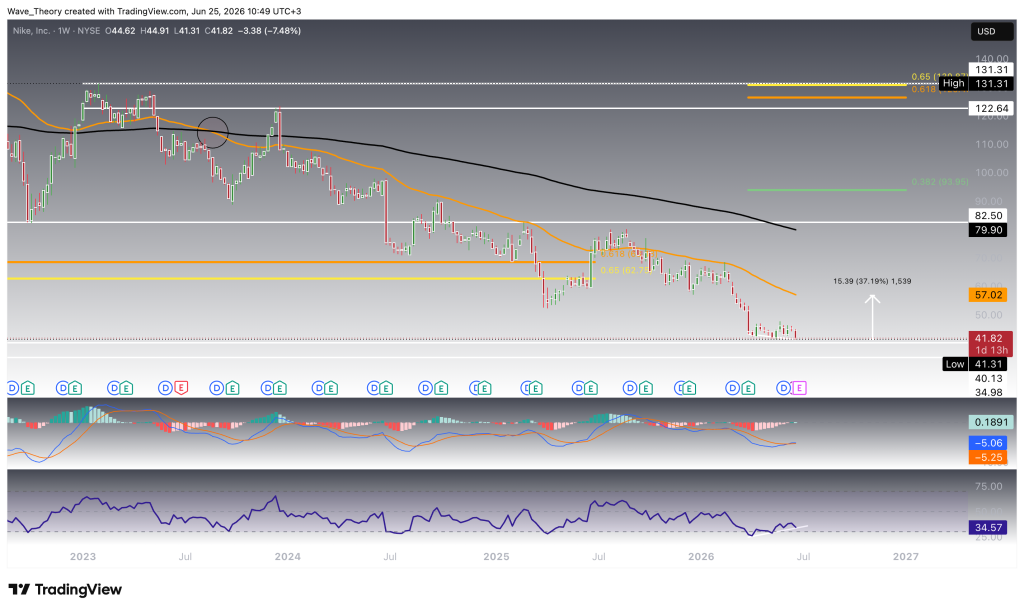
On the weekly chart, the downtrend is fully entrenched and accelerating. Nike closed down 7.48% at $41.82, slicing to a new low of $41.31 within a $41.31 to $44.91 range. The descending 50-week-EMA at $57.02 and the falling 200-week-EMA at $79.90 form a textbook death cross, both sloping firmly lower above price. This stacked resistance caps any rally attempt well before the broken support shelves. The Golden Ratio zone between $62.75 and $68.48 now sits far overhead, reinforced by the 0.382 Fibonacci level at $93.95. A projection from current levels points 37.19% higher toward $57, yet that target merely reaches the first moving-average barrier. The weekly momentum picture remains heavy. The MACD lines stay bearishly crossed, with the histogram starting to tick bearishly lower again. That faint flicker hints at decelerating downside, not reversal. The RSI however sits slightly above oversold regions and could form a bullish divergence, worth monitoring. This could catapult the price up to its next major resistance at the 50-week-EMA at $57, implying upside of 37%.
Daily Chart Signals Capitulation Followed by a Fragile Basing Attempt
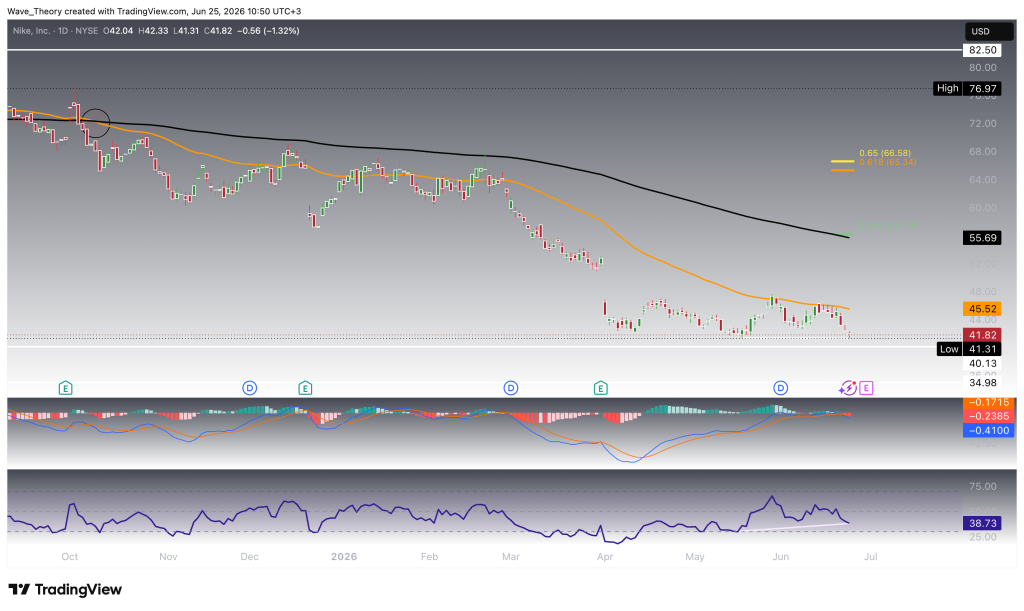
On the daily chart, the technical indicators continue to favor the bears. The EMAs have formed a Death Cross, confirming the short- to medium-term trend remains bearish.
At the same time, the MACD lines are bearishly crossed, while the MACD histogram continues to trend lower. This reflects persistent bearish momentum.
However, the RSI has formed a bullish divergence, signaling that downside momentum may be fading. As a result, NIKE stock could rebound toward the 50-day EMA at $45.5. This level has repeatedly acted as strong resistance and triggered multiple bearish rejections.
Only a decisive breakout above the 50-day EMA would open the door for a rally toward the 200-day EMA at $55.7. This level also coincides with the 0.382 Fibonacci resistance, making it a major technical hurdle.
For now, a bearish rejection at the 50-day EMA near $45.5 appears more likely. In that case, NIKE could revisit the historical support zone between $35 and $40.
4-Hour Chart Continues to Point Toward Further Downside
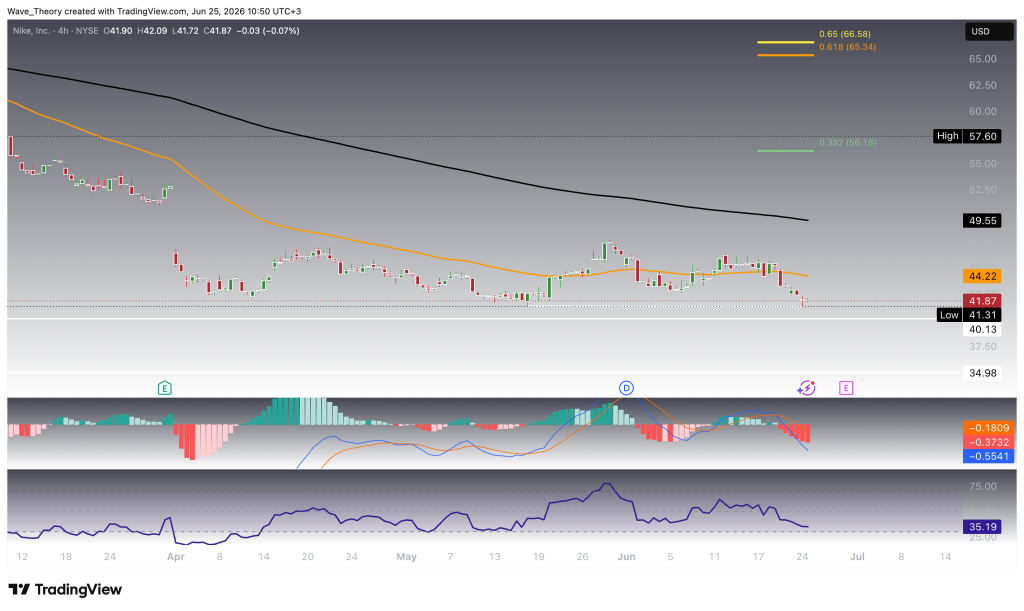
On the 4-hour chart, the recent relief rally has stalled, and bearish momentum is beginning to strengthen again. NIKE closed virtually unchanged at $41.87, down just 0.07%, but the intraday structure continues to deteriorate toward the key support zone between $35 and $40.
The technical indicators remain predominantly bearish. The RSI continues to move in neutral territory, while the MACD lines remain bearishly crossed. At the same time, the MACD histogram continues to trend lower, reflecting increasing downside momentum.
Meanwhile, the EMAs maintain a Death Cross, confirming that the short-term trend remains bearish.
To the upside, the 50-period EMA on the 4-hour chart at $44.2 serves as the first major resistance. Above that, the 200-period EMA near $49.5 represents the next significant hurdle. Additional Fibonacci resistance levels await at $56 and $67, creating multiple barriers before a sustained bullish reversal can develop.
Nike (NKE) — Bearish, Trend Broken
NKE has fallen ~77% from its $179.10 high and lost Golden Ratio support ($62.75–$68.48), turning it into resistance. The quarterly closed down 20.83% at $41.82, below all major averages, with a weekly death cross confirming the downtrend. Daily and 4h show only faint positive divergences, not reversals. Rallies stay corrective until $62 is reclaimed.
Key levels:
- Resistance: $44 (orange MA), $57 (projection/MA), then $62.75–$68.48 (Golden Ratio), $93.95 (0.382 fib)
- Support: $41.31 (immediate low), then open air toward $40.13/$34.98
- Bias: Bearish below $62; sell rallies into $44–$45
- Watch: $41.31 — a sustained break opens fresh downside
- Check out our free forex signals
- Follow the top economic events on FX Leaders economic calendar
- Trade better, discover more Forex Trading Strategies
- Open a FREE Trading Account
- Read our latest reviews on: Avatrade, Exness, HFM and XM
Related Articles


Sidebar rates
Related Posts
