Robinhood Stock (HOOD): Can the Recovery Rally Double Its Price?

Quick overview
- Robinhood stock has rebounded 77% from the Golden Ratio support level between $58 and $63, reaching a recent high of $103.25.
- The stock is currently facing key resistance between $119.32 and $122.21, which, if broken, could invalidate its correction phase and target the all-time high of $153.86.
- While the monthly indicators show mixed signals, the MACD histogram has started to tick bullishly, suggesting potential upside momentum.
- Immediate support levels are at $98 and between $77.80 and $85, with caution advised if the price falls below these levels.
Robinhood stock has staged a strong rebound after finding support at the critical Golden Ratio level near $63. Following the bullish reaction, the stock now attempts to build upside momentum. Can Robinhood invalidate its correction phase and resume its long-term uptrend, or will sellers regain control at key resistance levels?
Robinhood Rebounds 77% From Golden Ratio Support Toward Fibonacci Resistance
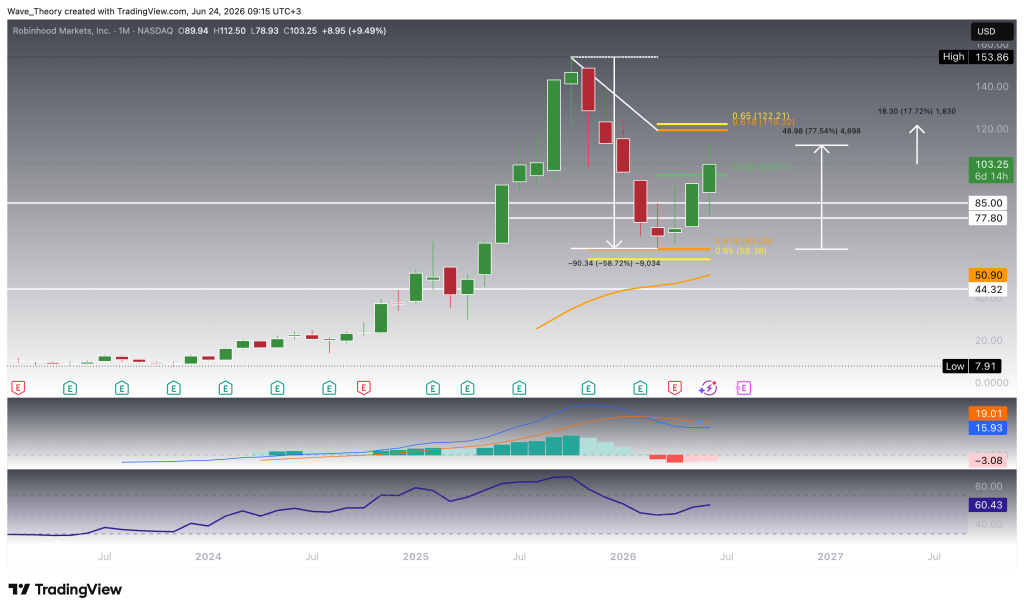
Following a sharp decline of nearly 59% from its all-time high near $153.86, Robinhood found a floor at the Golden Ratio support zone between $58 and $63. From that base, the stock staged a powerful rebound of roughly 77% toward the $112.50 swing high. Last month, price decisively reclaimed the 0.382 Fibonacci resistance at $98, and this month it printed a strong green candle, closing up 9.49% at $103.25. The structure now points toward the critical Golden Ratio resistance between $119.32 and $122.21.
A decisive monthly close above that band would invalidate the correction off $153.86 and significantly strengthen the bullish outlook. In that scenario, Robinhood could revisit its record high near $153.86, with a measured projection pointing roughly 17.72% higher, and potentially establish new peaks. For now, the descending trendline from the all-time high still caps the advance, while price remains anchored to the historical support shelf between $77.80 and $85. The monthly indicators currently provide mixed signals. The MACD histogram has started to tick bullishly higher last month, while the MACD lines are bearishly crossed. The RSI sits in neutral territory at 60.43, offering no clear directional bias.
Weekly Structure Confirms the Recovery With a Bullish MACD Crossover
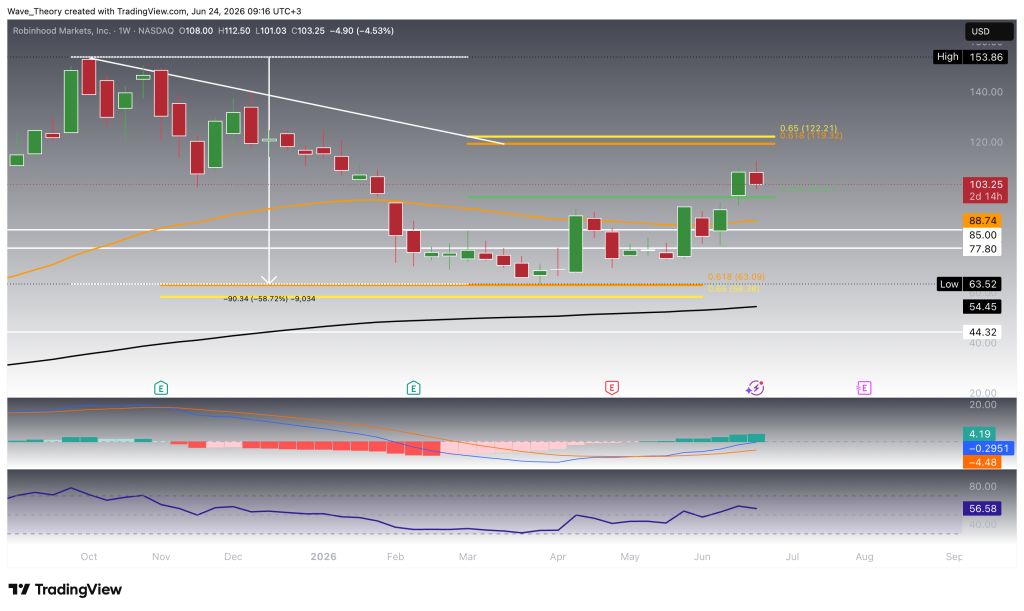
On the weekly chart, Robinhood pulled back 4.53% and dropped to $103.25, trading within a $101.03 to $112.50 range. The recovery originated from the $63.52 swing low, landing precisely on the Golden Ratio support zone. Price has since reclaimed both the 0.382 Fibonacci level at $98 and the 50-week exponential moving average at $88.74.
Beneath the structure, the 200-week-EMA average near $54.45 continues to rise, reinforcing the underlying trend. The Golden Ratio resistance between $119.32 and $122.21 remains the decisive hurdle, capped by the broken downtrend line. A weekly breakout above that zone would confirm the correction is fully resolved and open a path back toward $153.86. The momentum picture here is encouraging. The MACD histogram shows a clear uptrend for numerous weeks, while the MACD lines established a bullish crossover. Meanwhile, the EMAs continue to display a golden crossover, which confirms the trend bullishly in the mid-term.
The RSI has recovered to 56.58 from the high-30s, signalling renewed strength. This red weekly candle reads as healthy digestion rather than a trend reversal, provided the $85 level continues to hold. For now, Robinhood finds immediate support at the 0.382 Fib level at $98, the 50-week-EMA at $88.74 and at the historical support range between $77.8 and $85.
Daily Pullback Holds Above the Previous 0.382 Fib Resistance
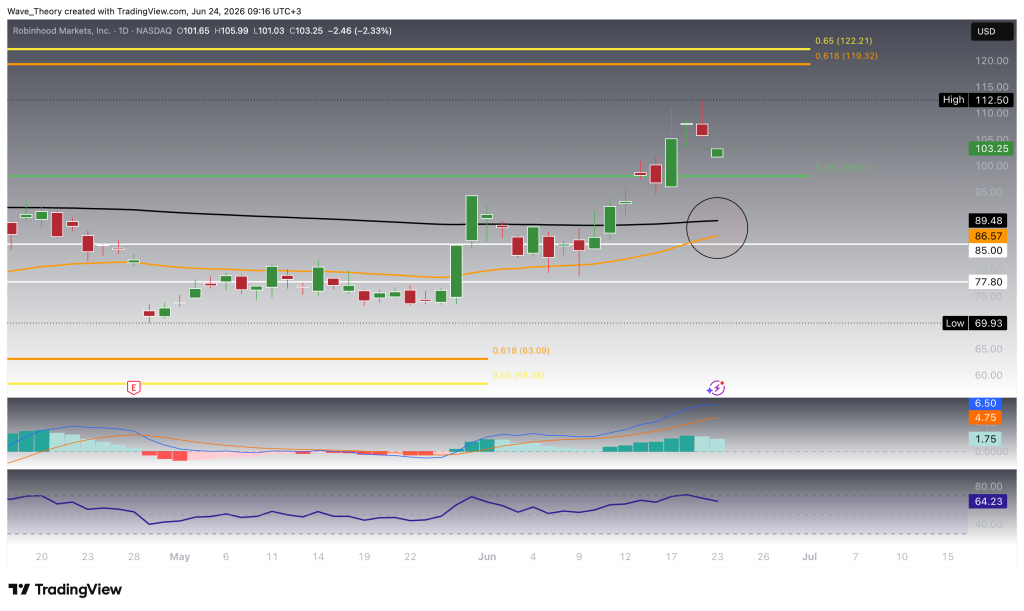
The daily timeframe shows Robinhood easing 2.33% to $103.25 within a tight $101.03 to $105.99 range. The broader advance ran from the $69.93 low up to the $112.50 high, and the two consecutive red candles since that peak represent an orderly pullback rather than distribution.
Just above it, the 0.382 Fibonacci level at $98 stands as the first line of defence, while the Golden Ratio resistance at $119 to $122 remains the longer-term target. The indicators are fairly bullishly. The MACD lines are bullishly crossed and the EMAs could potentially form a golden crossover, confirming the trend bullishly in the short- to medium term. The RSI is neutral and the MACD histogram started to tick bearishly yesterday.
Dips into the $98 region should continue to attract buyers while the structure holds. Otherwise Robinhood finds major support between $78 and $85.
Four-Hour Chart Cools Within Its Rising Channel
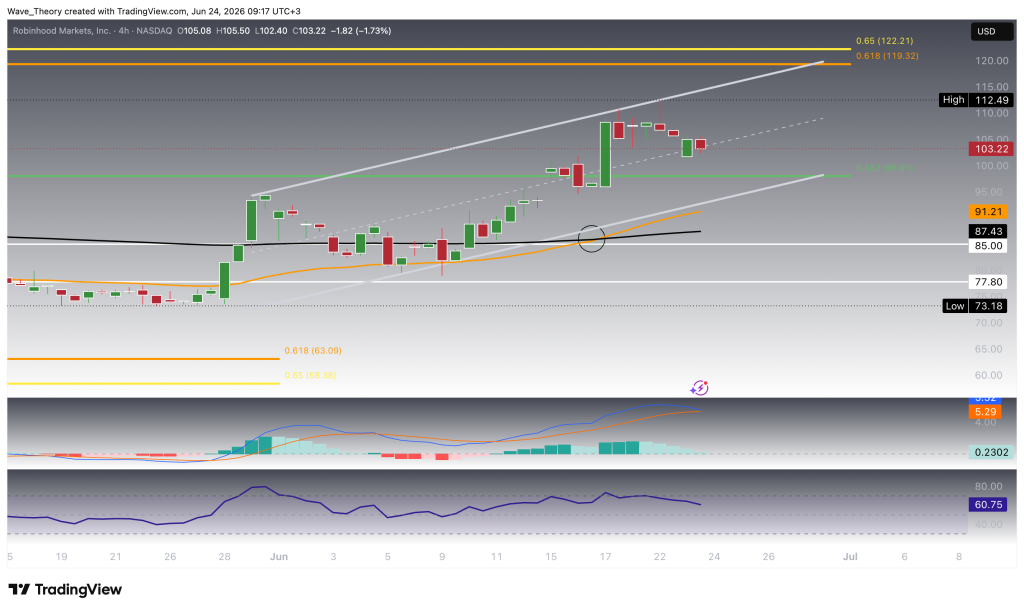
On the 4-hour chart, Robinhood slipped 1.73% to $103.22, inside a $102.40 to $105.50 bar. Price has climbed a well-defined ascending channel from the $73.18 low toward the $112.49 high, and it is now retreating toward the channel’s dashed median line near $103. The circled zone marks a fresh golden cross, as the 50-4H-EMA at $91.21 crosses above the 200-4H-EMA at $87.43. This bullish signal aligns neatly with the $85 support shelf directly below. Should selling extend, the green 0.382 Fibonacci level at $98 becomes the next test, while the Golden Ratio resistance between $119.32 and $122.21 still defines the upside objective. Momentum, however, is flashing caution on this lower timeframe. The MACD histogram has thinned to 0.2302 even as the signal line holds near 5.29. More notably, the RSI has recently slipped to 60.75 from roughly 80, forming a bearish divergence against price. This warns of near-term consolidation, even as the larger channel structure remains firmly intact.
Robinhood (HOOD) — Bullish, Momentum Cooling
HOOD rebounded 77% off Golden Ratio support ($58–$63) and reclaimed the 0.382 fib at $98. The monthly closed strong at $103.25, but momentum is softening: the monthly MACD histogram rolled to −3.08 and the 4h shows RSI divergence. The structure stays constructive while $85 holds, with a breakout above $119–$122 needed to target the $153.86 high.
Key levels:
- Resistance: $112.50 (recent high), then $119.32–$122.21 (Golden Ratio), then $153.86 (ATH)
- Support: $98 (0.382 fib), $89/$86 (EMA confluence), $85, then $77.80
- Bias: Bullish above $85; caution if $98 breaks
- Check out our free forex signals
- Follow the top economic events on FX Leaders economic calendar
- Trade better, discover more Forex Trading Strategies
- Open a FREE Trading Account
- Read our latest reviews on: Avatrade, Exness, HFM and XM
Related Articles


Sidebar rates
Related Posts
