Gold (XAU/USD) at $2,320 Amid Fed Rate Cut Expectations and Geopolitical Tensions
Gold (XAU/USD) prices remained under pressure during the Asian session on Monday, hovering near a three-week low of $1,940 per ounce.

Gold (XAU/USD) prices remained under pressure during the Asian session on Monday, hovering near a three-week low of $2,320 per ounce.
“The impact of escalating rates throughout April dampened home buying, even with more inventory in the market,” said Lawrence Yun. “But the Federal Reserve’s anticipated rate cut later this year should lead to better conditions, with improved affordability & more supply.” #NARPHS
— NAR Research (@NAR_Research) May 30, 2024
Key Economic Data Impact
The Bureau of Economic Analysis reported a 0.3% rise in the Personal Consumption Expenditures (PCE) Price Index for April, holding steady at 2.7% year-over-year. Core PCE also rose by 2.8%, aligning with expectations.
The Bureau of Economic Analysis (BEA) released its second estimate for the first quarter Gross Domestic Product (GDP), showing an annualized growth rate of 1.3%.#USGDP #EconomicGrowth #MarketAnalysis #ConsumerSpending
𝐑𝐞𝐚𝐝 𝐌𝐨𝐫𝐞: https://t.co/q4ew6OCrDe pic.twitter.com/zCW7WkhMq0
— GQ Research (@GQresearch24) June 3, 2024
These figures reinforce the likelihood of a rate cut, further driving down U.S. Treasury yields and supporting gold prices.
Global Geopolitical and Economic Development
Geopolitical tensions in the Middle East and optimism over a Gaza ceasefire, announced by U.S. President Joe Biden, have limited gold’s downside. Additionally, China’s Caixin Manufacturing PMI rose to 51.7 in May, boosting investor confidence.
However, the overall positive tone in equity markets and anticipation of crucial U.S. macro data, including the Nonfarm Payrolls (NFP) report, are capping significant upward movement in gold prices.
Market participants are also eyeing key central bank events, with the Bank of Canada’s decision on Wednesday and the European Central Bank meeting on Thursday, expected to further influence gold’s trajectory.
Overall, while gold finds some support from easing inflation and geopolitical tensions, its upside remains capped by a robust risk appetite in equity markets and cautious investor sentiment ahead of significant economic data releases.
Gold Price Forecast
Gold is trading at $2,321.05, near its pivot point of $2,324.79. Immediate resistance levels are $2,336.33, $2,350.36, and $2,366.51.
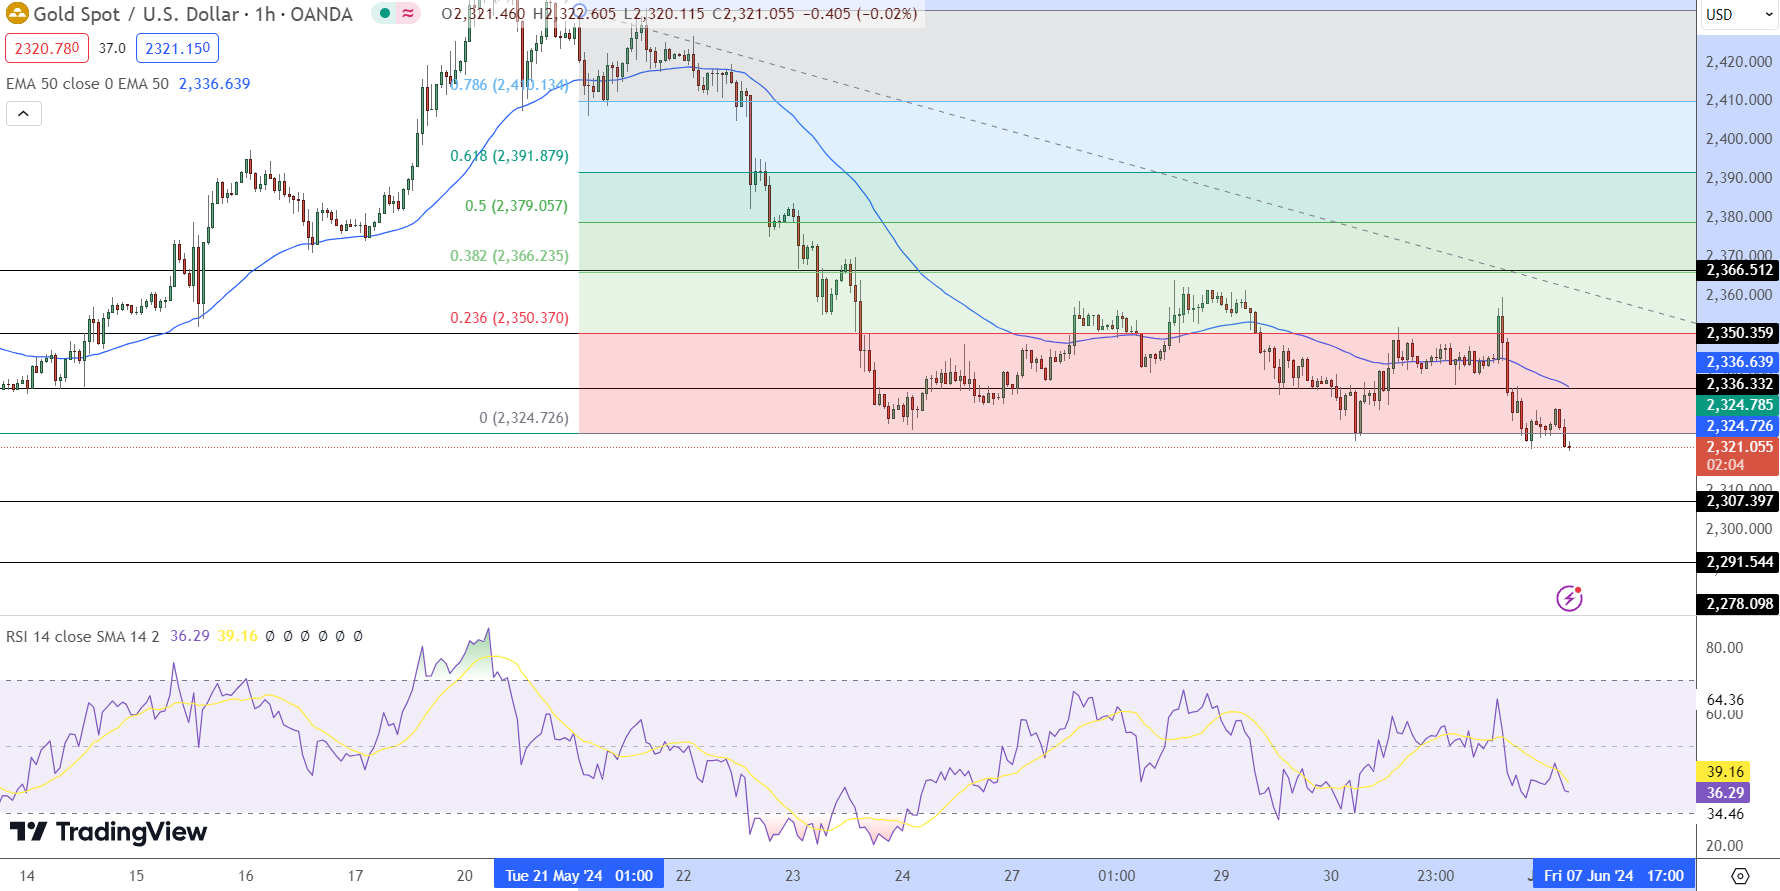
On the downside, support levels are $2,307.40, $2,291.54, and $2,278.10. The RSI is at 36, indicating a potential oversold condition, while the 50-day EMA is $2,336.64, acting as resistance.
In conclusion, the outlook remains bearish below $2,324.80. A break above this pivot point could shift the bias to bullish. Conversely, staying below this level may continue to pressure gold prices downward.
- Check out our free forex signals
- Follow the top economic events on FX Leaders economic calendar
- Trade better, discover more Forex Trading Strategies
- Open a FREE Trading Account
- Read our latest reviews on: Avatrade, Exness, HFM and XM

Related Articles



Sidebar rates

Related Posts
 Save
Save