With the recent bull run in the crypto market, crypto-related stocks like Coinbase have seen substantial gains, reflecting the broader market’s strength. Coinbase stock has recently broken out of a critical technical zone, suggesting a strong potential for further upward movement.
Coinbase Stock Breaks Out Bullishly
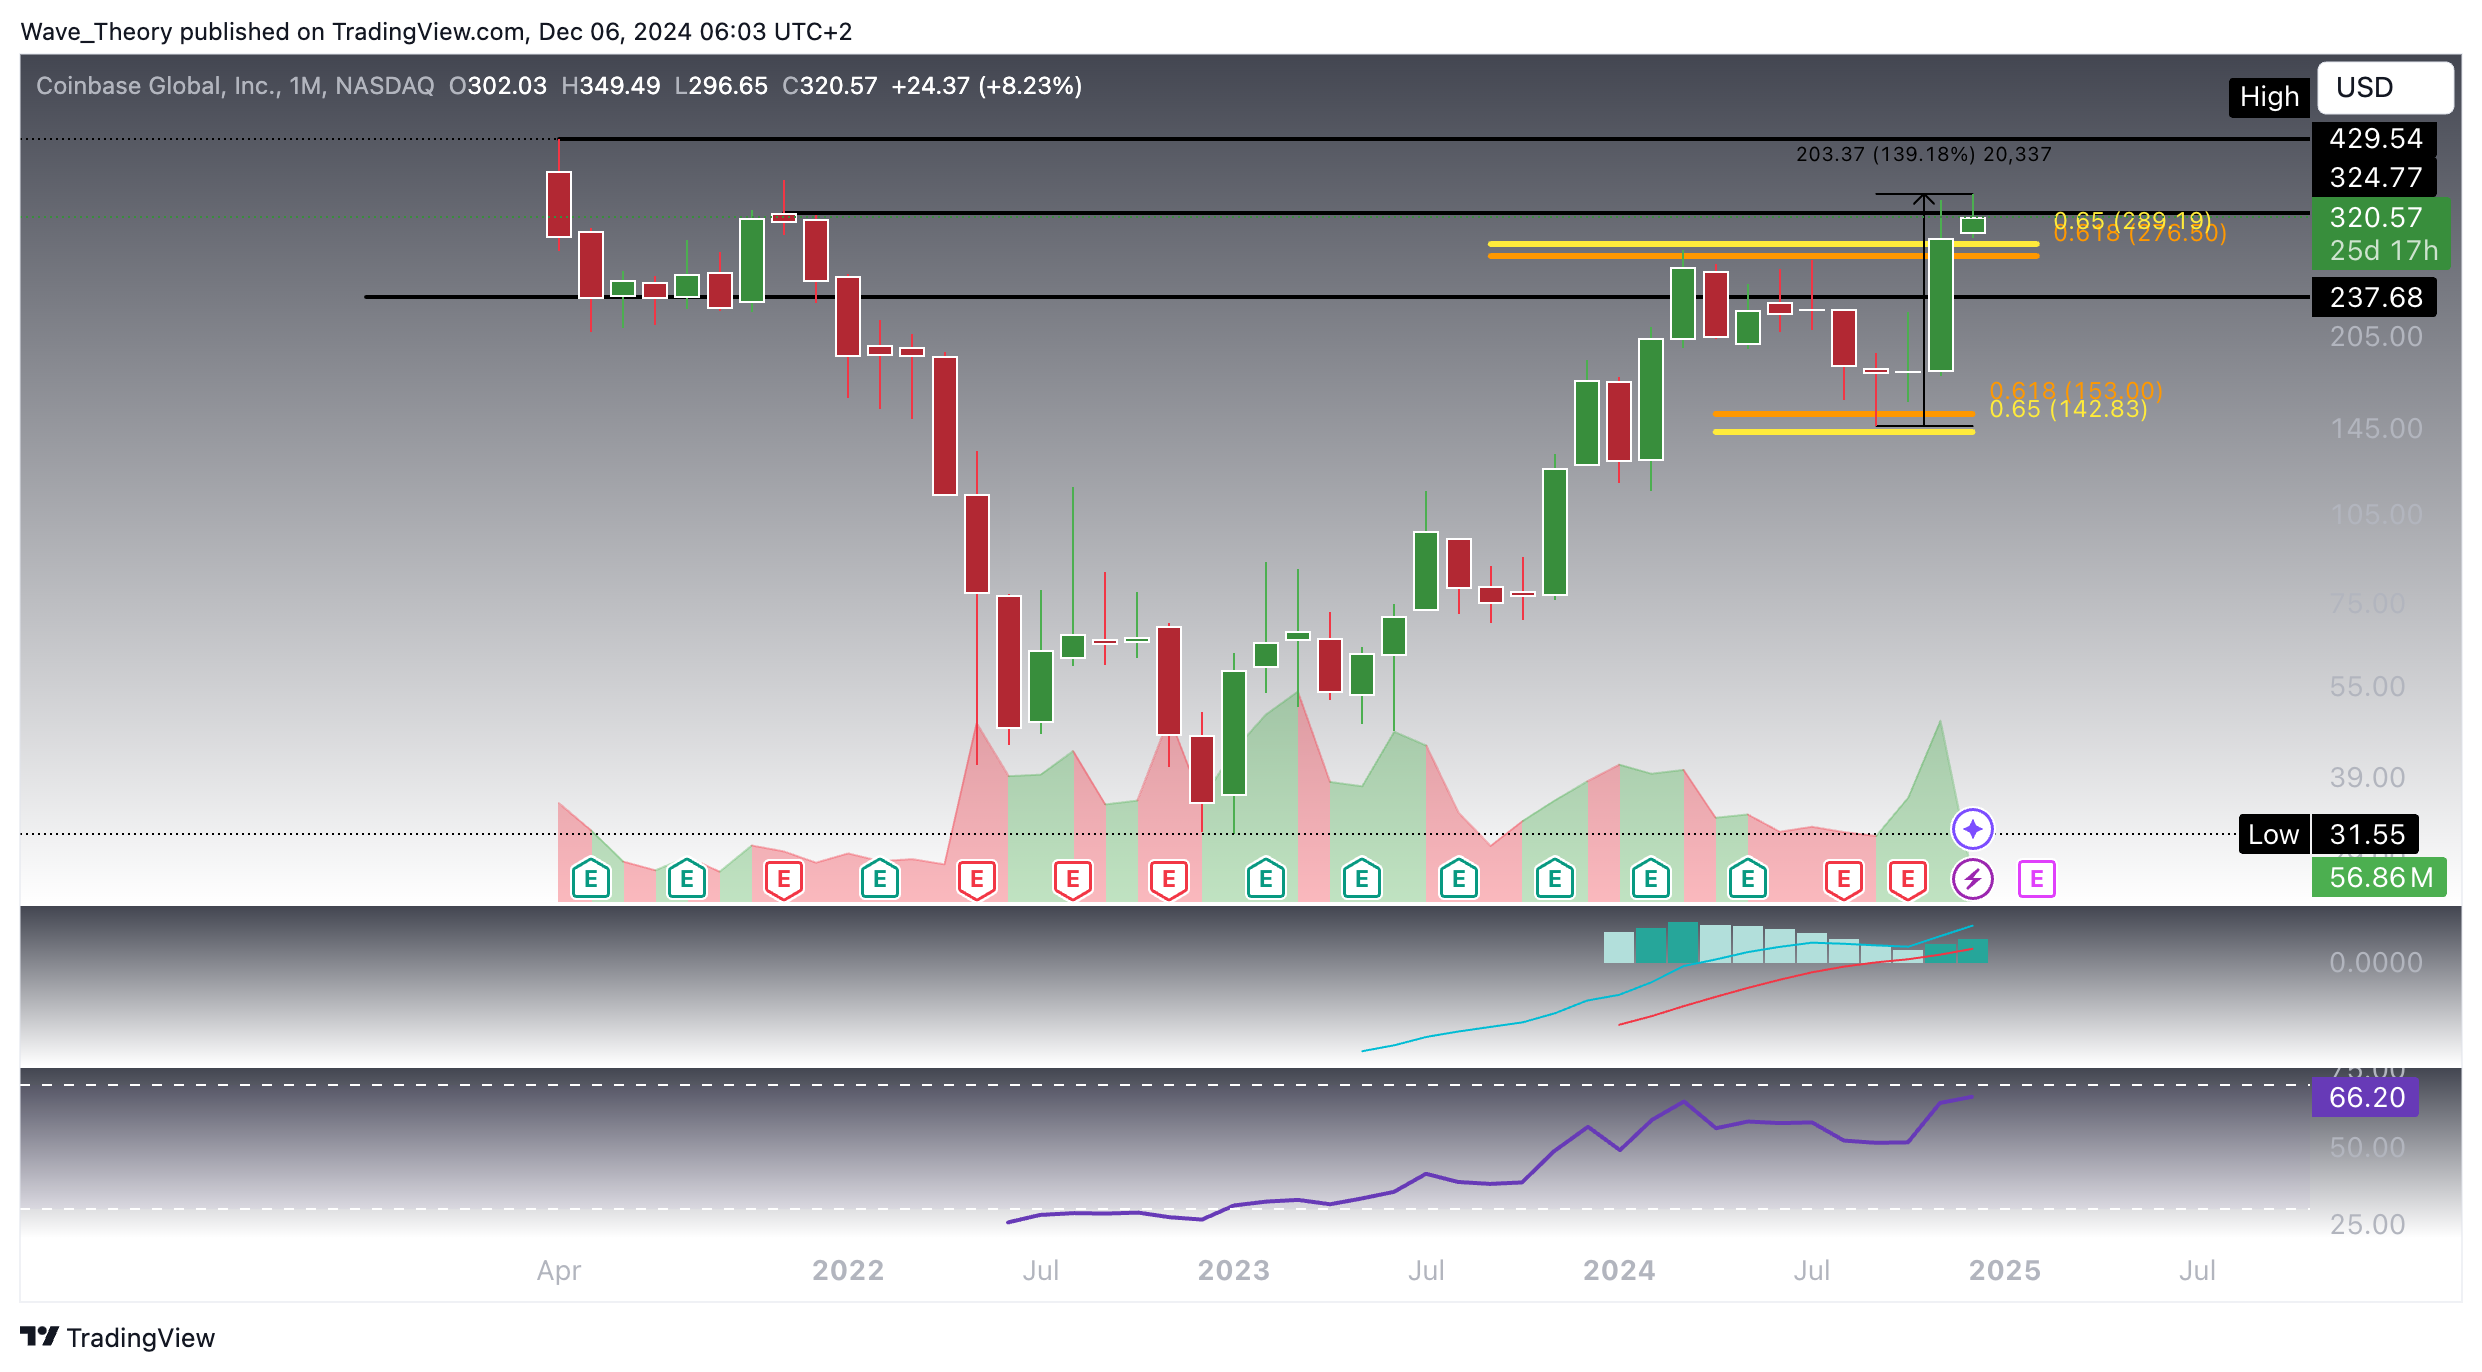
Coinbase recently surged past the golden ratio resistance at $289, a key level where it previously faced rejection, initiating a correction down to the $143 support. From there, the stock bounced strongly, rising by 139%. The recent breakout above $289 signals an invalidated downtrend and marks the beginning of a new bullish phase.
With this breakout, the stock is now positioned to potentially return to its all-time high (ATH) of around $430. The market’s sentiment has shifted positively, and Coinbase could be on track to reach previous highs if momentum continues.
Technical Indicators Support Bullish Momentum
Several indicators reinforce this bullish outlook on the monthly chart:
The MACD histogram has been ticking higher, indicating strengthening momentum.
MACD lines remained in a bullish formation, further confirming the positive trend.
The RSI, while approaching overbought levels, remains in neutral territory, providing room for additional gains before reaching overextended conditions.
Coinbase
Coinbase (COIN) Is Positioned For A Potential 34% Rise
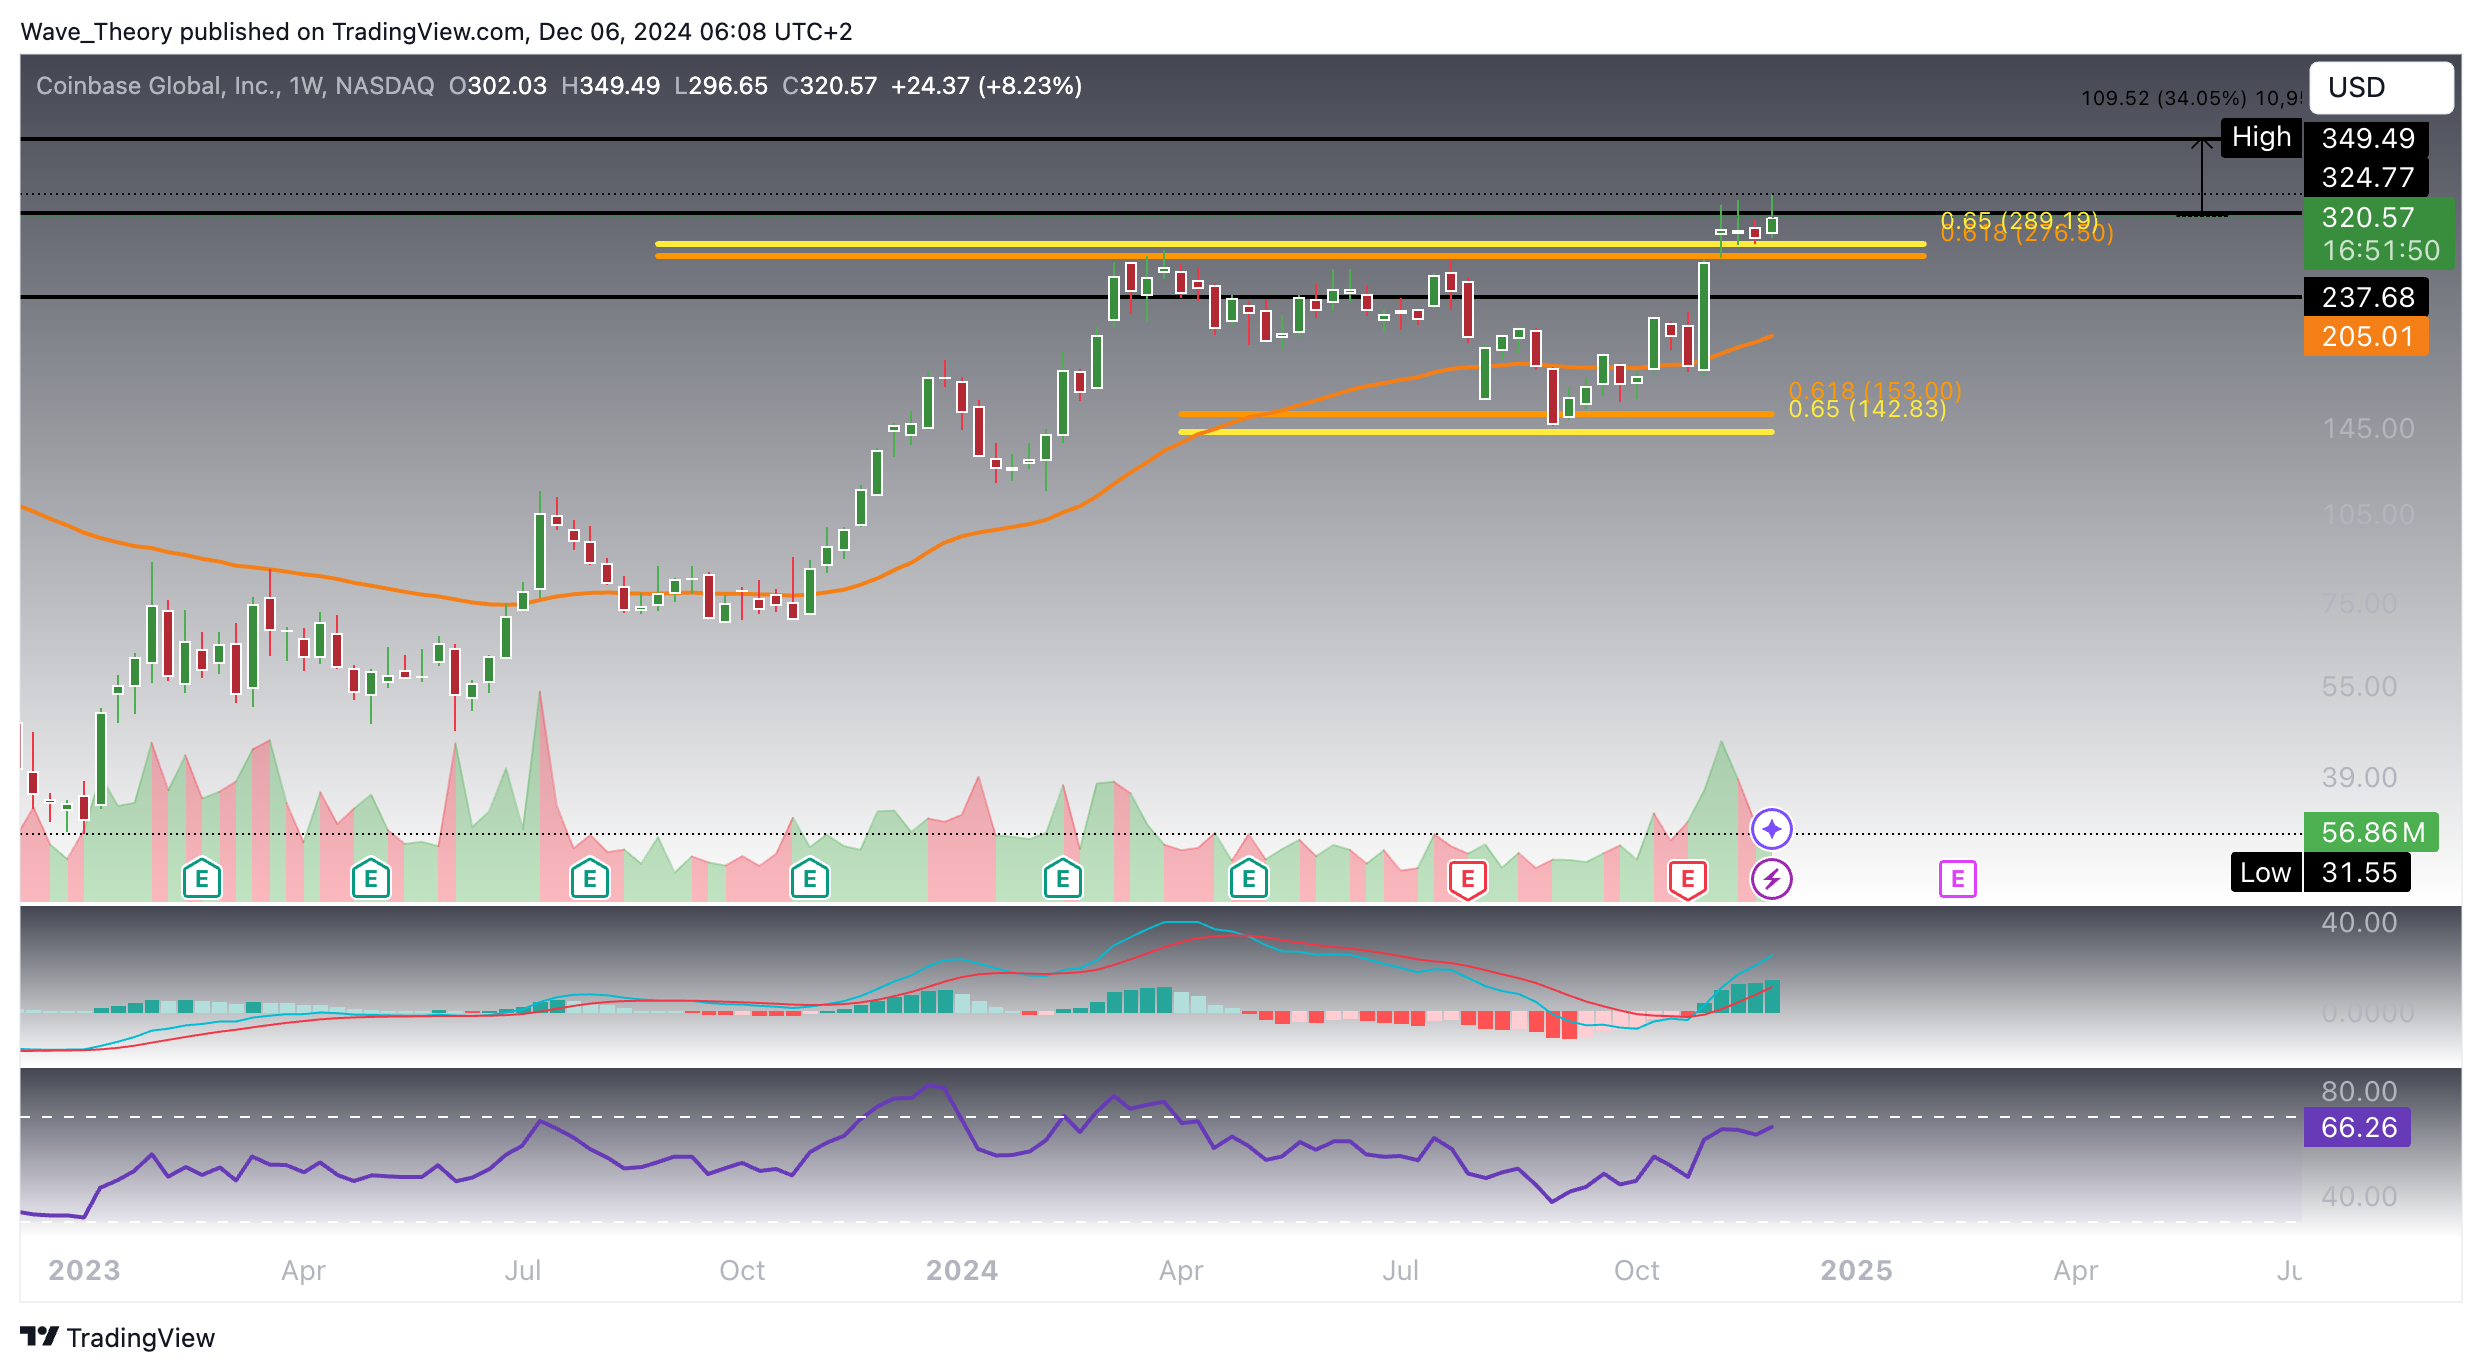
The key golden ratio level at $289, previously a major resistance, now serves as support. If this level holds, the stock could see a surge toward its all-time high (ATH) of approximately $430, representing a further upside of about 34%.
The MACD histogram continues to show increasing bullish momentum, with the MACD lines having crossed bullishly, suggesting continued strength in the upward trend. Meanwhile, the RSI is approaching overbought territory but hasn’t signaled any bearish divergence or reversal, indicating that the stock has room to run before reaching overextended conditions.
Overall, if the current support at $289 holds, Coinbase stock could be on track for another significant rise, potentially reaching its ATH in the coming months.
Coinbase
Mixed Signals On The Daily Chart
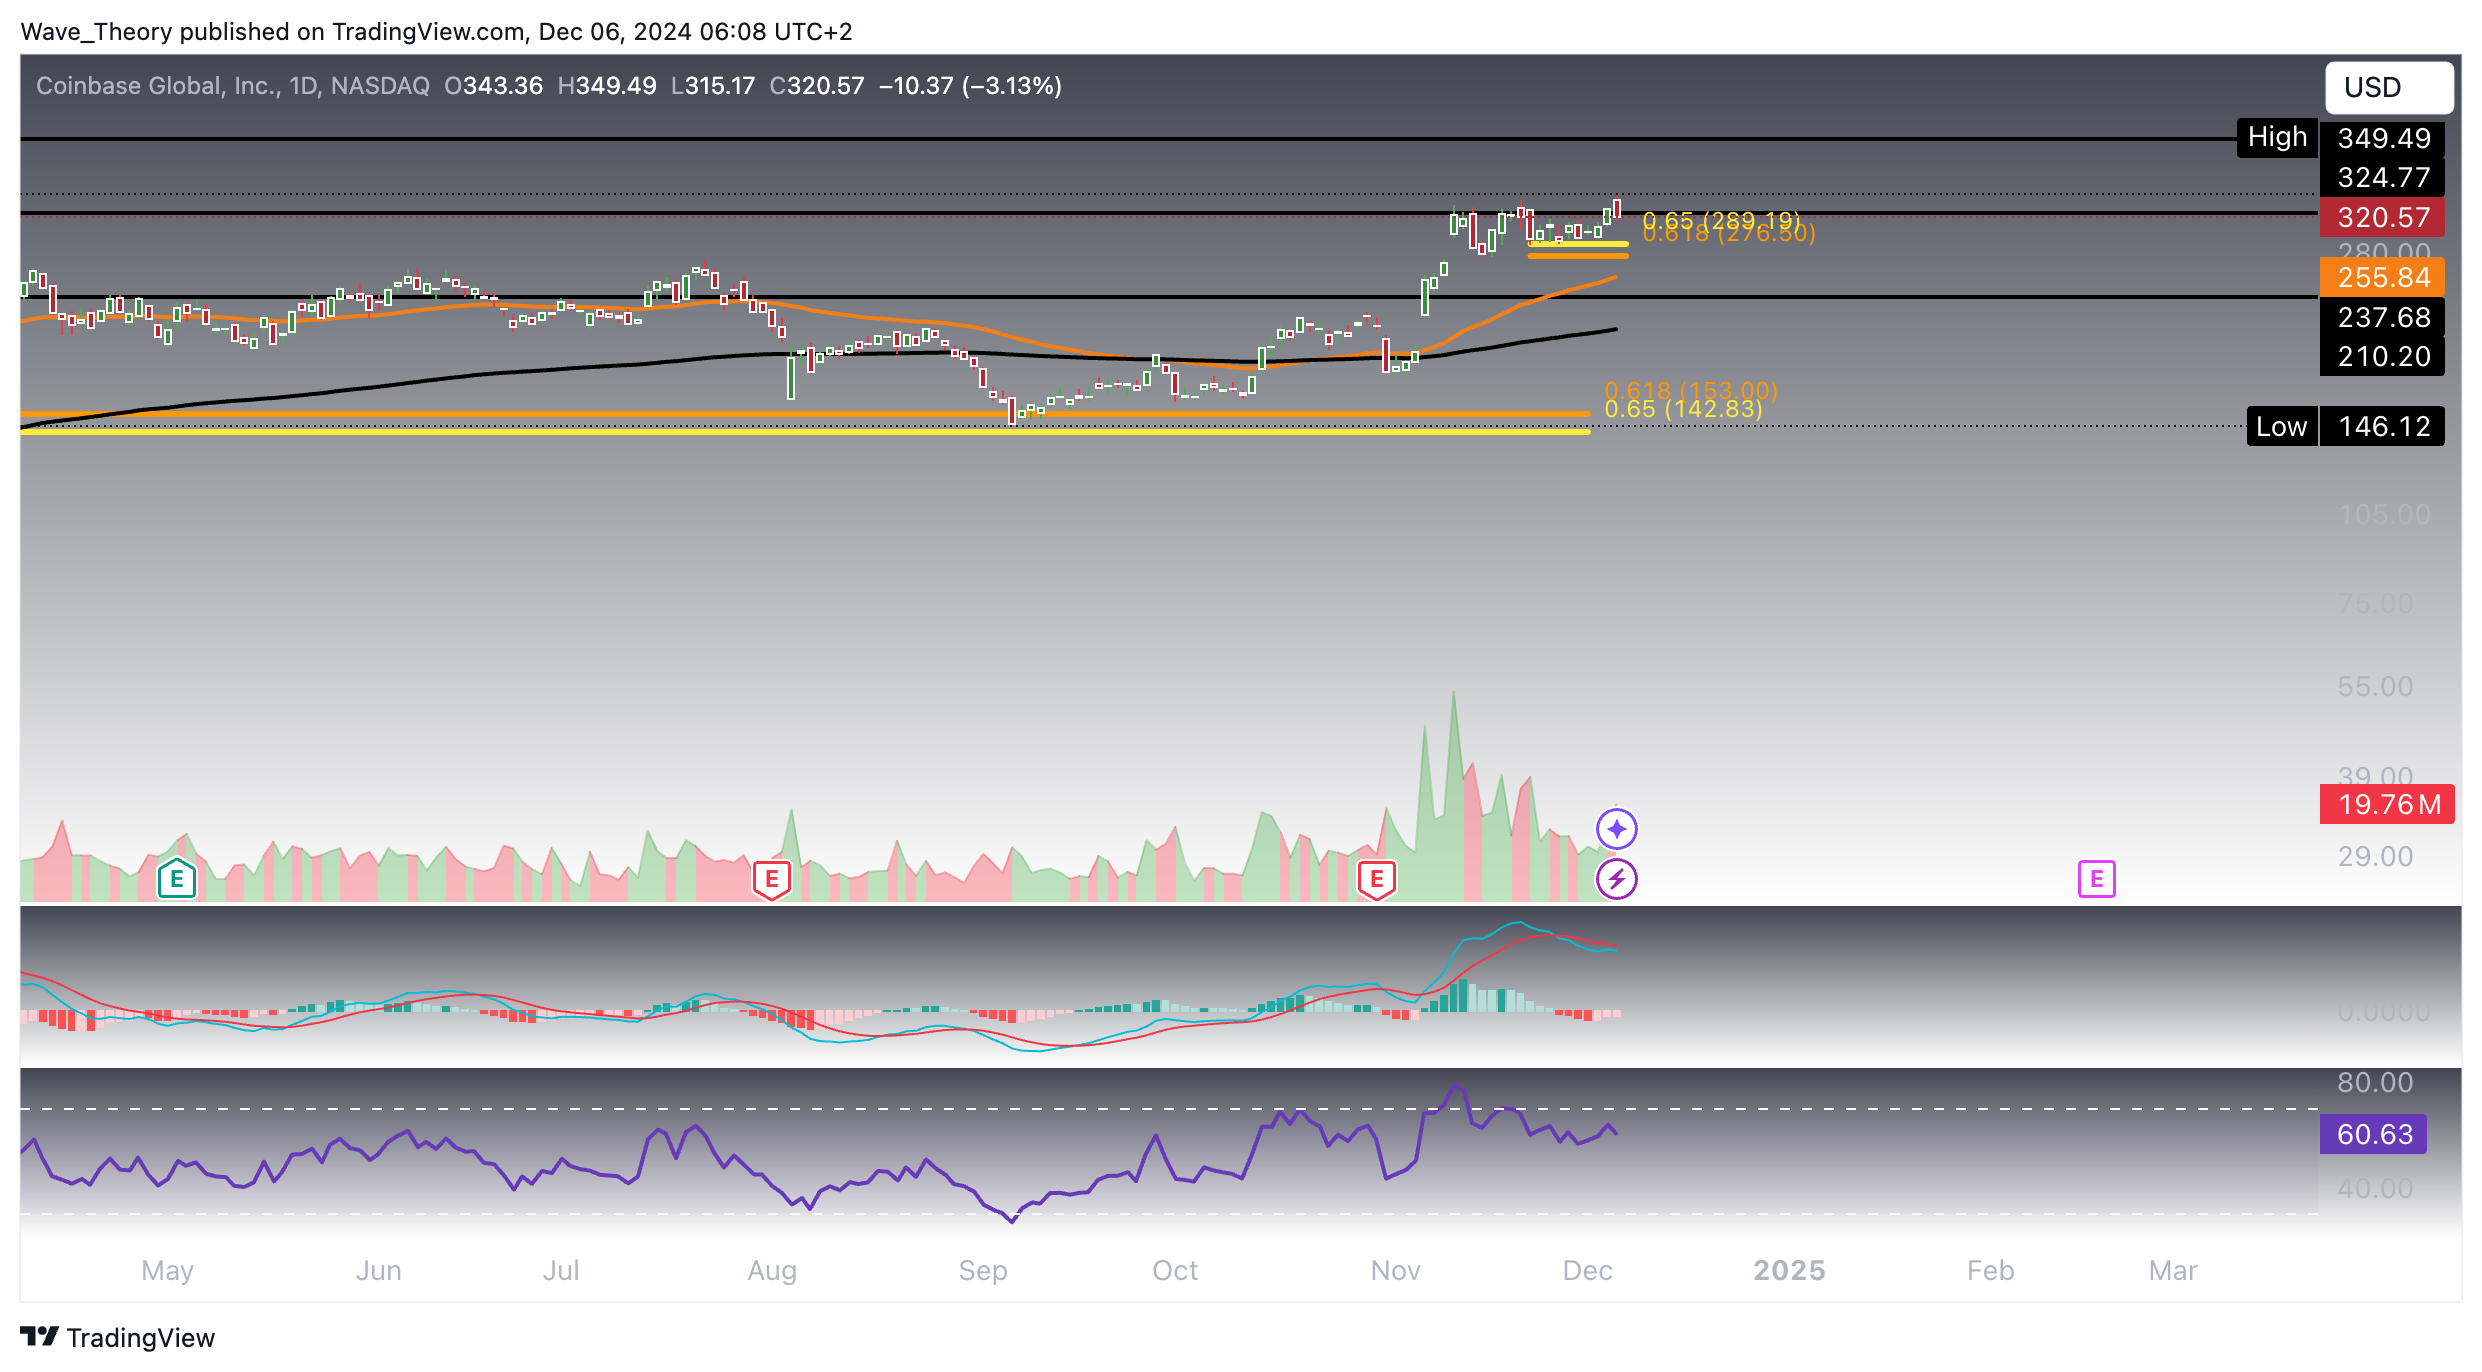
On the daily chart, Coinbase (COIN) presents mixed signals, suggesting both bullish and cautionary factors. The EMAs have formed a golden crossover, a strong bullish indicator signaling upward momentum in the short- to medium-term. Additionally, the MACD histogram has been ticking higher for the past three days, reinforcing the ongoing bullish sentiment. However, the MACD lines have crossed bearishly. Moreover, the RSI remains in neutral territory, oscillating without a clear signal of overbought or oversold conditions, which adds a level of uncertainty.
Should Coinbase experience a correction and fail to hold the golden ratio support at $289, the next key support levels would be:
The 50-day EMA at $256, which could provide near-term support.
The 200-day EMA at $210, acting as a stronger support zone in the event of a deeper correction.
A break below these levels could signal a potential shift in momentum, but as long as the $289 golden ratio support holds, the bullish trend remains intact.
Coinbase
Emerging Bearish Divergence Poses Risk to Coinbase (COIN) Price: Key Support Levels to Watch
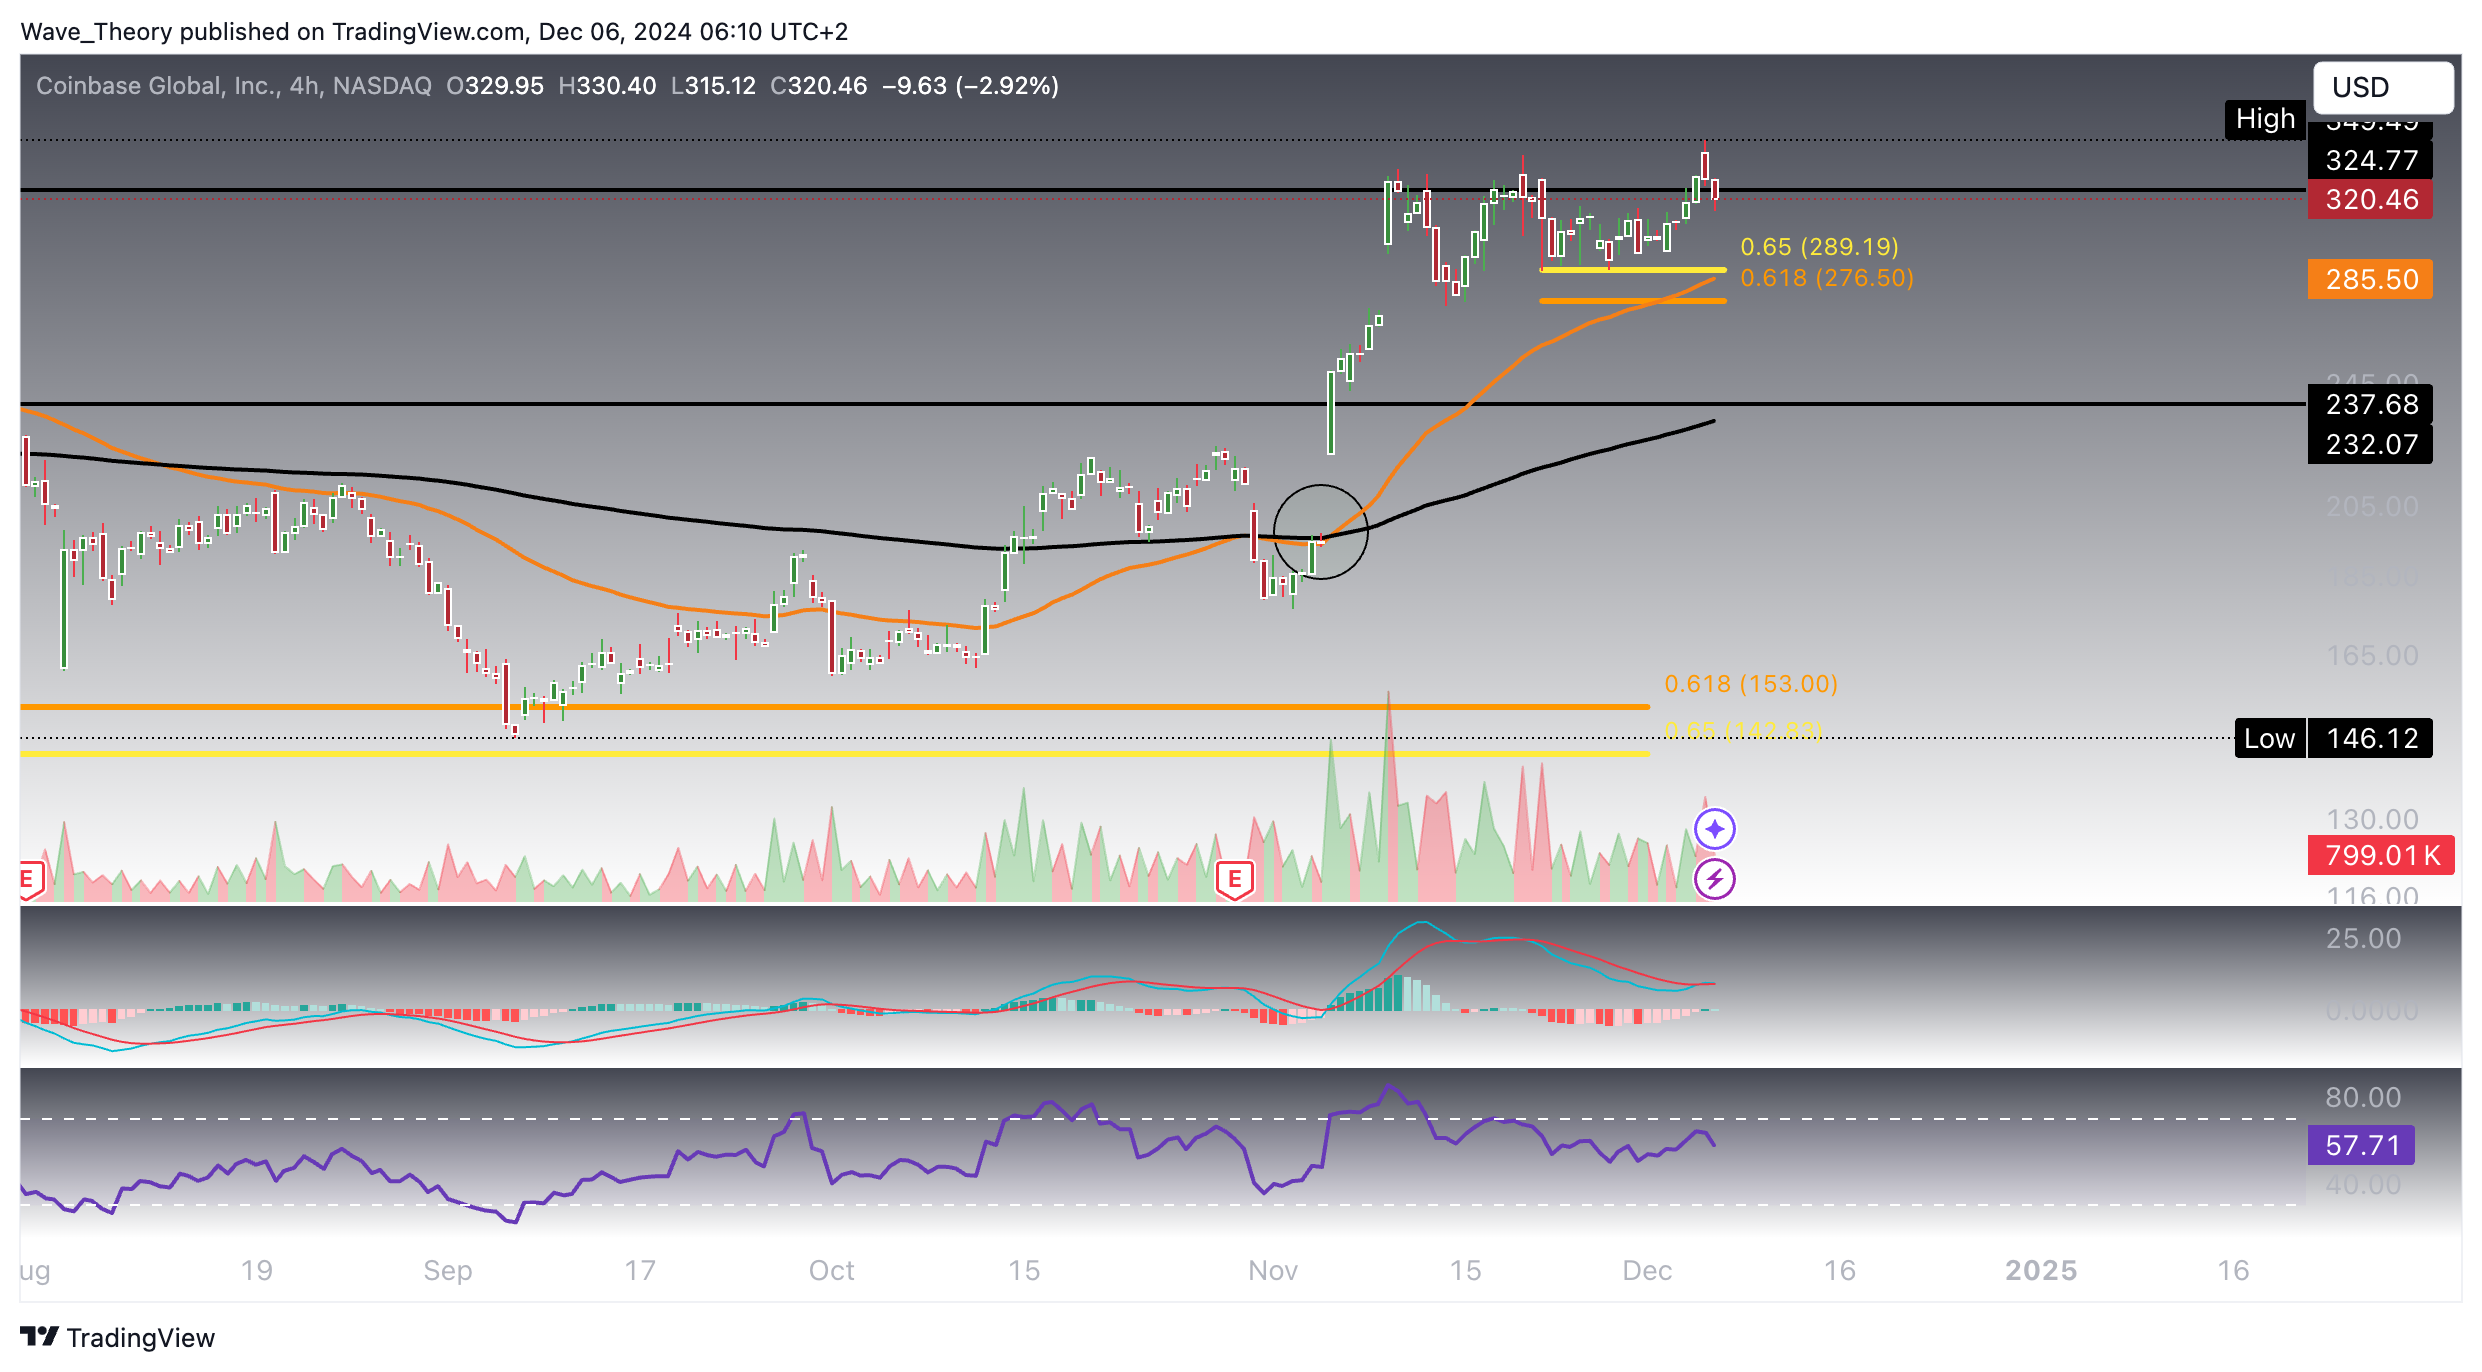
The indicators on the 4-hour chart for Coinbase (COIN) paint a bullish short-term outlook, though with some cautionary signals. The EMAs have recently formed a golden crossover, which confirms the bullish momentum in the short-term. Additionally, the MACD lines are on the verge of crossing bullishly, with the MACD histogram showing an ongoing bullish trend, reinforcing the upward movement.
However, a bearish divergence in the RSI signals potential downside risk. This divergence suggests the momentum may be slowing, and could lead to a pullback in price. If this occurs, Coinbase could fall to the golden ratio support zone between $276.5 and $289, where additional support is provided by the 50-4H-EMA.
Coinbase
In summary, while the short-term signals are mostly bullish, the RSI’s bearish divergence indicates the potential for a temporary correction to the $276.5–$289 support range. If this support holds, the bullish trend could continue.
Konstantin Kaiser comes from a data science background and has significant experience in quantitative trading. His interest in technology took a notable turn in 2013 when he discovered Bitcoin and was instantly intrigued by the potential of this disruptive technology.