Silver Price Forecast: $59.12 Test Ahead After Breakout Rally Hits Key Ceiling
Silver’s powerful late-November rally finally met resistance this week as the metal hit $57.86, its strongest level in more than a month.

Quick overview
- Silver's recent rally peaked at $57.86, facing resistance in a key supply zone.
- Momentum has cooled as the RSI indicates early signs of exhaustion, suggesting a potential pullback.
- Traders are watching key support levels around $54.40 and $54.20, which could confirm the uptrend if held.
- A bullish reversal candle above $54.40 could signal fresh demand and pave the way for another attempt at the $56.70 ceiling.
Silver’s powerful late-November rally finally met resistance this week as the metal hit $57.86, its strongest level in more than a month. The surge capped a clean “three white soldiers” structure from the $52.70 base, a pattern that typically signals strong trend conviction. Buyers repeatedly defended higher lows and kept silver pinned above the 20-EMA on the 4-hour chart, giving the uptrend steady fuel.
But momentum cooled sharply as price pushed into the $56.04–$56.70 supply zone. The latest candle printed a long upper wick, almost a textbook shooting-star rejection, suggesting sellers became far more active as silver approached multi-month highs.
Overbought Signals Start to Build
The RSI pushed above 71 before easing back, highlighting early signs of exhaustion. No bearish divergence has formed yet, but the pullback in momentum shows the rally is stretched rather than reversing outright.
This exhaustion aligns with the chart’s history: silver reacted from this same zone in mid-October, making $57.80 a clear structural ceiling. When price rejects from a level twice, traders usually treat it as a strong point of supply unless momentum breaks decisively.
Key levels traders are watching:
- Immediate support: $54.40 — the prior breakout zone
- Dynamic support: 20-EMA near $54.20
- Trendline support: $52.70 — higher-low base since late October
What a Healthy Pullback Looks Like
A controlled retreat into the $54.20–$54.40 region would actually strengthen the broader uptrend. When resistance turns into support, it confirms the breakout’s validity.
If silver holds above $54.40 and prints a bullish candle, such as a hammer, a small engulfing bar, or a spinning top, it would signal fresh demand stepping in.
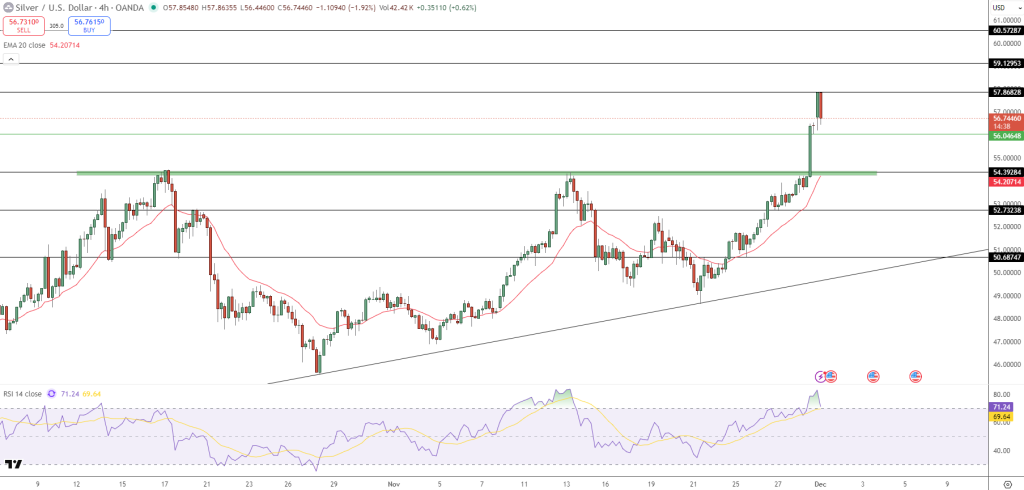
That setup keeps the trend intact and positions silver for another attempt at the $56.70 ceiling. A decisive break above that zone opens the path toward $59.12, the next significant resistance level.
Silver (XAG/USD) Trade Setup
A constructive long entry sits around $54.40–$54.20 with confirmation from a bullish reversal candle. A protective stop below $53.80 keeps risk contained. Upside targets sit at $56.70 and $59.12 if momentum rebuilds.
Silver still holds a strong structural uptrend, but the next winning entry is likely to come after the market cools, not at the top of a vertical spike.
- Check out our free forex signals
- Follow the top economic events on FX Leaders economic calendar
- Trade better, discover more Forex Trading Strategies
- Open a FREE Trading Account
- Read our latest reviews on: Avatrade, Exness, HFM and XM
Related Articles

Sidebar rates
Related Posts
