XRP Technical Flags and Institutional Wins Signal a $2.80 Breakout
XRP is currently around $2.00, which is about 2% less than it was 24 hours ago. The cryptocurrency is still going through a period of

Quick overview
- XRP is currently trading around $2.00, experiencing a 2% decline over the past 24 hours while showing signs of consolidation.
- Technical indicators suggest a potential bullish trend, with analysts targeting a price increase to $2.80 by the end of the month.
- A recent breakout from a falling wedge pattern and a bull flag formation on the charts indicate possible upward momentum if XRP maintains support above $2.00.
- Increased trading volume and a strong accumulation pattern in on-chain data further support the bullish outlook for XRP.
XRP XRP/USD is currently around $2.00, which is about 2% less than it was 24 hours ago. The cryptocurrency is still going through a period of consolidation after a lot of price changes. Even while there is some weakness in the short term, a number of technical indicators across different timeframes are showing a more positive picture. Analysts are aiming for a move toward $2.80 by the end of the month.
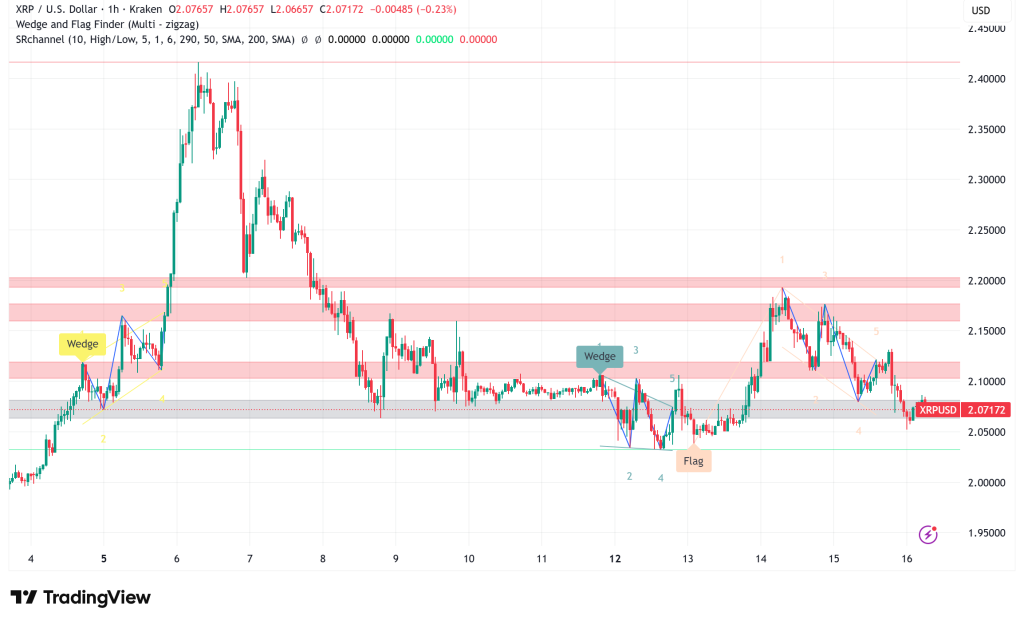
Falling Wedge Breakout Sets Stage for $2.70 Rally
The most important technical change is that XRP’s two-day chart shows that the coin broke out of a falling wedge pattern on January 1st. This classic bullish pattern, which has two downward-sloping trendlines that come together, usually means that selling pressure has run out and momentum is about to change.
XRP needs to stay above the important $2.00 support level for the breakout to be valid. Right now, that’s where it’s trading. If the price stays above this level for a while, it could go up to $2.40, and the pattern’s measured target is $2.70. Trader CryptoWIZRD says that this setup is like a falling wedge breakout that happened in Q4 2024 and led to a huge 486% price explosion.
The similarity is interesting: both setups had long periods of sideways trade before big rallies higher happened.
Bull Flag Formation Points to $2.80 Target
XRP’s eight-hour chart shows a bull flag formation right now, which adds weight to the bullish argument. The price is testing resistance around the flag’s upper trendline at $2.15. A close above this level would mean that the next leg up is coming.
If the breakout goes well, the first goal will be the top of the flag pole at $2.41. After that, the goal will be the entire measured move objective of the pattern at $2.80. This might mean a 40% rise from where it is now, and it would be XRP’s highest price since it peaked near $3.34 in January 2025.
There are signs that technical momentum indicators are starting to back up this view. The Relative Strength Index (RSI) on the eight-hour chart rose from 42 to 51 on Monday, which suggests that bullish pressure is rising. A break over the downtrend line of a descending channel at $2.30 on the daily chart might also confirm a bigger trend change toward $2.70.
XRP’s Onchain Data Reveals Strong Accumulation Pattern
Onchain measurements are backing up a bullish scenario in addition to chart patterns. The 90-day Spot Taker Cumulative Volume Delta (CVD) reveals that buy orders have been more common than sell orders since November 2024, even though prices have been moving around a lot.
This number shows that traders are more and more willing to buy XRP at market prices instead of waiting for cheaper entry points. This shows that they are becoming more confident that prices will go up. XRP is up 16% in 2025, even if it has fallen recently. The current CVD pattern looks like the one from July 2024, which led to a 65% surge in just a few weeks.
XRP Trading Volume Surges Despite Price Consolidation
There is a bigger and bigger gap between how much trade is going on and how prices are doing. XRP just became Australia’s BTC Markets exchange’s most traded cryptocurrency, beating Bitcoin for the first time in four years. This was due to strong community support and the platform’s status as a Ripple On-Demand Liquidity partner.
This big jump in trading volume—up 17% with average trade sizes up 25%—suggests that investors are becoming more experienced, not just interested in making a quick buck. But the higher activity hasn’t yet led to a steady rise, as XRP has had trouble keeping gains over $2.10 after a quick climb toward $2.20.
XRP Price Outlook: Key Levels to Watch
For bulls, the major goal right now is to get back above the $2.15 resistance level and stay above the upper boundary of the bull flag. If this works, it will confirm the technical setup and probably cause algorithmic purchasing to push the price up to $2.40 and then $2.80.
On the other hand, if the price doesn’t stay above $2.00, the falling wedge breakout will be invalid, and the price might fall even more to $1.80, where the token found support in late 2024.
- Check out our free forex signals
- Follow the top economic events on FX Leaders economic calendar
- Trade better, discover more Forex Trading Strategies
- Open a FREE Trading Account
- Read our latest reviews on: Avatrade, Exness, HFM and XM
Related Articles
Sidebar rates
Related Posts
Ava

