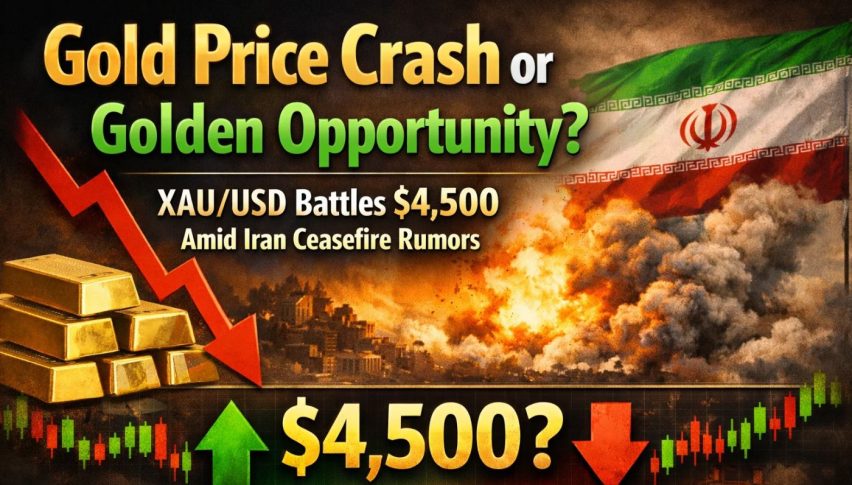
Gold Price Crash or Golden Opportunity? XAU/USD Battles $4,500 Amid Iran Ceasefire Rumors
The gold market has turned into a high-stakes battleground for gold bulls and bears right now. As of March 26, 2026...
Quick overview
- The gold market is currently experiencing volatility, with prices fluctuating between $4,490 and $4,530 after a significant drop from record highs earlier in the year.
- Geopolitical tensions, particularly regarding Iran, have paradoxically failed to boost gold prices, as rising oil prices and hawkish central bank signals have made gold less attractive to investors.
- Analysts are watching key price levels, with $4,100 seen as a critical support line for the long-term bull trend in gold.
- Despite recent declines, major investment banks remain optimistic about gold's future, with predictions of a year-end target of $5,400 to $6,000 driven by structural buying and global diversification.
The gold market has turned into a high-stakes battleground for gold bulls and bears right now. As of March 26, 2026, the price of spot gold is sort of stuck in limbo, teetering between $4,490 and $4,530 an ounce . This is a market that’s been caught in a bit of a tug-of-war and is looking a bit wild right now. After gold catapulted all the way up to record highs of over $5,600 earlier in the year, it’s now retreated a massive 15% in just the last month or so.
All this back-and-forth has left both seasoned gold traders and new retail investors asking the same question: has the historic bull run finally come to an end, or is this actually the moment to ‘buy the dip’?
Why War Has Failed to Send Gold Prices Soaring
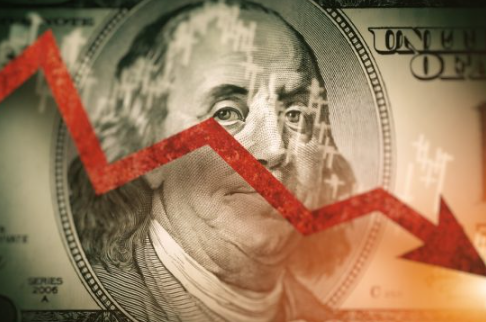
Geopolitical tensions are normally the perfect trigger for gold prices but the situation with Iran has created a bit of a paradox in the market. At first, the escalating conflict sent gold prices shooting way up, but the subsequent oil price surge to over $110 really put the brakes on things. This in turn sent stagflation fears racing around the globe and forced central banks- led by a very hawkish Fed – to signal that there would be no interest rate cuts in 2026.
Higher interest rates for longer actually make holding non-yielding gold even less attractive, so a lot of investors have started to do a bit of a rotation into high-yield bonds and the US Dollar instead. And now reports of a potential 15-point U.S.-Iran ceasefire proposal have taken away the ‘war premium’ and left gold looking rather rather vulnerable to some technical selling.
What the Charts are Saying: the $4,100 Line in the Sand
From an analyst’s perspective, the four-hour chart is showing us a bit of a textbook corrective phase right now. Gold recently tested an intraday low of a scary $4,100 – a level that lots of people consider to be the ‘line in the sand’ for the long-term gold bull trend.
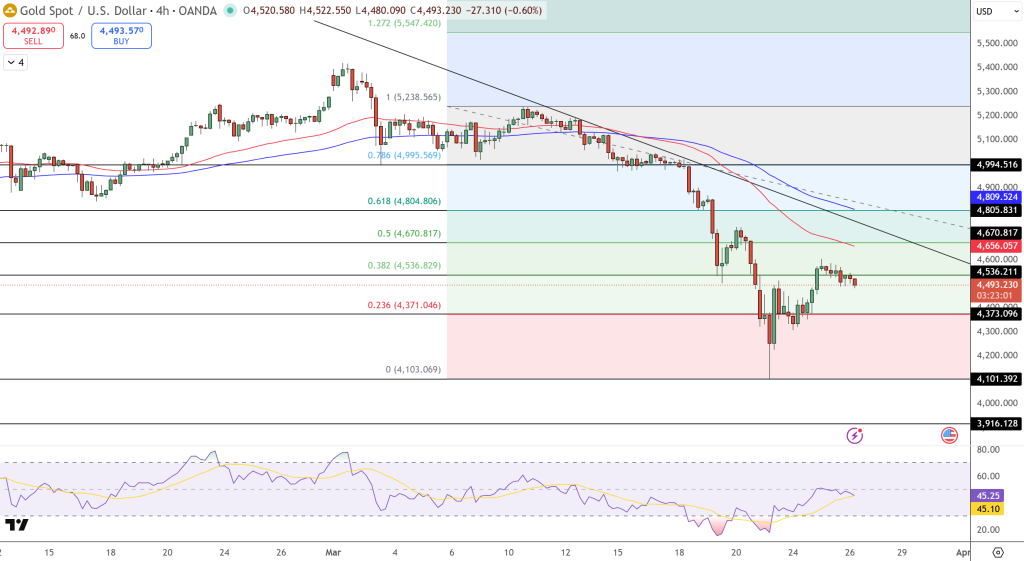
The immediate level to be looking out for is actually $4,536 ( the 38.2% Fibonacci level). If we can get back above $4,600 then we can start to think about invalidating the current bearish bias. If that recovery doesn’t actually happen then the first safety net is $4,370. And a breach of that level exposes the 200 day EMA at $4,200. The RSI is currently sitting at 45 which is kind of neutral, but to be honest – there just isn’t much volume coming in yet to confirm that we’re actually getting a full reversal here.
2026 Forecast: What the Big Players are Saying
Despite the recent bloodbath, a lot of the big investment banks are actually still pretty optimistic about the final quarters of 2026. Goldman Sachs is still holding to a year-end target of $5,400, saying that structural buying by central banks is still cruising way above 2022 pre-pandemic levels. And J.P. Morgan analysts are actually going even further, predicting a climb to $6,000 if we see a continued move away from the dollar in terms of global diversification.
While the short-term path is still a bit murky and very much driven by headlines, what’s starting to sound like a consensus from the big players is that there’s a ‘higher floor’ for gold than ever before. Traders really just need to keep an eye out for US Treasury yields and any official news on Middle Eastern peace talks – because these are going to be the main triggers for the next $200 move.
- Check out our free forex signals
- Follow the top economic events on FX Leaders economic calendar
- Trade better, discover more Forex Trading Strategies
- Open a FREE Trading Account
- Read our latest reviews on: Avatrade, Exness, HFM and XM
Related Articles

Sidebar rates
Related Posts
