Bitcoin Retails Under $69K Amid Geopolitical Risk-Off and $14B Options Expiry
There was no catalyst unique to cryptocurrencies that caused Bitcoin's 3.38% drop on Thursday. The significant decline in the diplomatic
Quick overview
- Bitcoin's recent drop was primarily influenced by geopolitical tensions between the U.S. and Iran, rather than any specific cryptocurrency-related catalyst.
- The market experienced significant forced liquidations, with $97 million in long positions being wiped out in just 24 hours, exacerbating the price decline.
- Despite short-term volatility, institutional buying has increased, suggesting a positive medium-term outlook for Bitcoin, with predictions of reaching $150,000 by the end of 2026.
- Current on-chain data indicates that long-term holders are not capitulating, which historically precedes significant price rallies.
There was no catalyst unique to cryptocurrencies that caused Bitcoin’s BTC/USD 3.38% drop on Thursday. The significant decline in the diplomatic ties between the United States and Iran was the catalyst for the macro-level action. Global markets firmly shifted into risk-off mode as a five-day diplomatic window was about to expire and President Trump sent direct warnings via Truth Social, saying there would be “no turning back” if negotiations failed. The Dow dropped 400 points, the S&P 500 lost 1.49%, and the Nasdaq fell 2.07% in the U.S. stock market. On the WTI and Brent benchmarks, oil increased by more than 4%.
Bitcoin is acting as a high-beta macro asset during severe global shocks rather than as a solitary safe haven, as evidenced by its close 92% correlation with gold during this phase. In the coming days, selling pressure might be rekindled by any escalation in the Middle East, especially a ground action or an increase in oil prices toward or beyond $100 per barrel.
Leverage Amplifies the Drop: $97M in Long Liquidations in 24 Hours
A series of forced sales in futures markets exacerbated the geopolitical shock. Over the course of the 24-hour period, Bitcoin long liquidations totaled $97.43 million, a 103% increase over the previous session. A self-reinforcing negative spiral was created when the price broke through short-term support levels, wiping away overextended leveraged holdings. Leverage operates as an accelerant, transforming a mild macro-driven decrease into a stronger intraday move. This dynamic is a recurrent aspect of Bitcoin sell-offs.
As a sign that undue leverage has been removed from the system—a necessary condition for any long-term recovery—traders should keep an eye out for stabilization in financing rates and a significant drop in open interest.
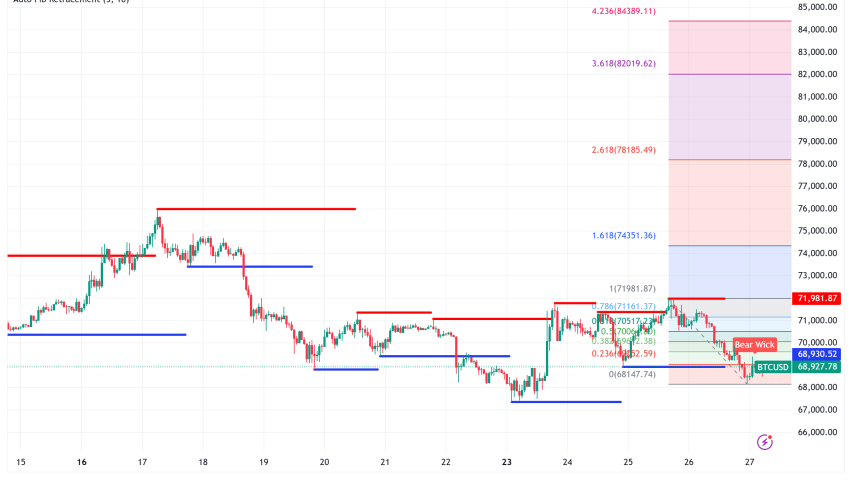
BTC/USD Technical Outlook: The $69,000 Line in the Sand
Technically speaking, Bitcoin is consolidating at a pivotal point. The main short-term support level is $69,000, which coincides with the daily pivot. A rebound toward $71,000, the 23.6% Fibonacci retracement resistance, is possible if this level is successfully defended. However, if selling pressure increases, a verified break below $69,000 exposes the previous swing low of $68,118 and might accelerate toward the $68,100 zone.
The expiration of $14.1 billion in Bitcoin options adds a substantial degree of complexity to today’s session. Market makers may have a structural incentive to suppress prices prior to settlement because the maximum pain price is $75,000, which is far higher than the present spot. During the expiry window, traders should keep a close eye on volume trends and price movement around $69,000.
Institutional Buying Builds a Floor, But Can It Hold?
The medium-term structural outlook for Bitcoin is still very positive despite the short-term volatility. In recent weeks, institutional inflows have made a strong comeback. Spot Bitcoin ETFs experienced a six-day run of inflows, with a week-long period in early March that came close to $1 billion. Through its permanent preferred equity vehicle, Strategy paid $1.6 billion for 22,237 BTC and announced plans to fund $44.1 billion for further purchases. A 2-4% cryptocurrency allocation is advised for investors by Morgan Stanley, which filed to introduce its own spot Bitcoin ETF. On March 26, a proposed Labour Department rule that would permit Bitcoin investments in the $10 trillion 401(k) market passed the White House regulatory review. Additionally, Coinbase introduced token-backed down payments for Fannie Mae mortgages, giving Bitcoin owners access to liquidity without having to make a taxable sale.
Citing Bernstein’s $150,000 price prediction by the end of 2026, Bloomberg analysts pointed out that institutional data shows Bitcoin has “reached a floor.” Together, corporate entities and spot ETFs currently hold over 3.32 million Bitcoin, or 15.8% of the total supply. The likelihood of the cascade long-term holder selling observed in the 2018 and 2022 bear markets is significantly decreased by these individuals’ longer holding durations and reduced sensitivity to short-term volatility.
On-Chain Signals: A Historical Accumulation Zone
The current configuration gains a historically significant dimension from on-chain data. After falling as low as 50.8% on February 5, Bitcoin’s total supply in profit is currently at 60.6%, the lowest level since January 2, 2023. Similar circumstances have preceded significant rallies in previous cycles: in January 2023, Bitcoin was trading at $16,682 before rising 655% to $126,000, and in March 2020, it was trading at about $6,500 before reaching $69,000 in 2021.
Importantly, long-term investors are not experiencing capitulation-level stress because the long-term holder net unrealized profit/loss (LTH-NUPL) is currently at about 0.40. Additionally, short-term holding inflows to Binance have drastically decreased, dropping to 25,000 BTC from about 100,000 BTC during the February sell-off. This indicates a discernible decrease in reactive selling by more recent participants. Although the direction of travel is noteworthy, valuation models such as MVRV, NUPL, and the Puell Multiple are not yet at the distressed levels that have historically indicated price bottoms.
Bitcoin Price Prediction: Near-Term Bearish, Medium-Term Constructive
Near-term (24–72 hours): The $14.1 billion options expiration today and upcoming geopolitical developments will have a significant impact on the result. The balance of probabilities favors ongoing consolidation between $68,100 and $71,000. A relief rally toward $71,000 might be triggered by a hold over $69,000. Technically speaking, a close below $68,118 would be detrimental and might prompt another test in the $67,000–$66,500 region.
Medium-term (2–4 weeks): The idea that $70,000 and below is a desirable accumulation zone for larger players is supported by the institutional demand backdrop, which includes ETF inflows, corporate accumulation, and the developing regulatory environment. A return to the $75,000–$76,000 area could be greatly aided by a partial resolution of the Middle East crisis.
Longer-term: Institutional adoption patterns and on-chain supply dynamics are still generally positive. Bernstein analysts continue to aim for $150,000 by the end of 2026. Given that LTH-NUPL is still positive and that short-term holder sell pressure is decreasing, the present decline seems more compatible with a mid-cycle correction inside an ongoing bull market than with the start of a structural bear phase.
- Check out our free forex signals
- Follow the top economic events on FX Leaders economic calendar
- Trade better, discover more Forex Trading Strategies
- Open a FREE Trading Account
- Read our latest reviews on: Avatrade, Exness, HFM and XM
Related Articles


Sidebar rates
Related Posts
