Bitcoin Price Prediction: BTC Crashes Through $67,830 as $300M in Longs Get Wiped – Is $63,830 the Floor?
On March 27, 2026, Bitcoin is trading at $66,632 after dropping below the $67,836 support and breaking its rising trendline from January...
Quick overview
- Bitcoin is currently trading at $66,632 after breaking key support levels and experiencing significant volatility due to a $14.16 billion options expiry.
- Negative market sentiment is evident, with 29 bearish signals and a Fear and Greed Index indicating extreme fear, as Bitcoin has dropped 21.6% this quarter.
- Despite the recent decline, institutional interest remains strong, with BlackRock's IBIT holding 784,062 BTC and positive ETF inflows for three consecutive weeks.
- Traders are advised to watch the $63,830 support level closely, as a potential bullish divergence could signal a buying opportunity.
On March 27, 2026, Bitcoin is trading at $66,632 after dropping below the $67,836 support and breaking its rising trendline from January in just one 4-hour candle. Today, $300 million in leveraged longs were liquidated, and a $14.16 billion options expiry added to the volatility. Now, traders are wondering if this is the bottom or just the start of a bigger drop.
Why Bitcoin Is Crashing Today
Several factors hit the market at once. Iran rejected US peace talks, which pushed oil prices above $100 and made financial conditions tighter for all risky assets. Ten-year Treasury yields are nearing 4.5%, their highest in a year, making it more expensive to hold speculative positions. The $14.16 billion BTC options expiry on Deribit, one of the biggest this year, is forcing market makers to hedge more aggressively. The max pain level is at $74,000, about 10% above the current price, which adds mechanical selling pressure to the existing fear.
Market sentiment is very negative. Technical indicators show 29 bearish signals and only 4 bullish ones. The Fear and Greed Index is now in extreme fear. Bitcoin is down 21.6% this quarter, marking its first back-to-back quarterly losses since 2022.
Glassnode data shows that retail investors started selling as Bitcoin dropped below $67,000, while large holders stayed mostly neutral. Institutional buyers have not stepped in with confidence yet, which is a worrying sign at this important support level.
Bitcoin Technical Analysis: Two Levels Broken, Structure Damaged
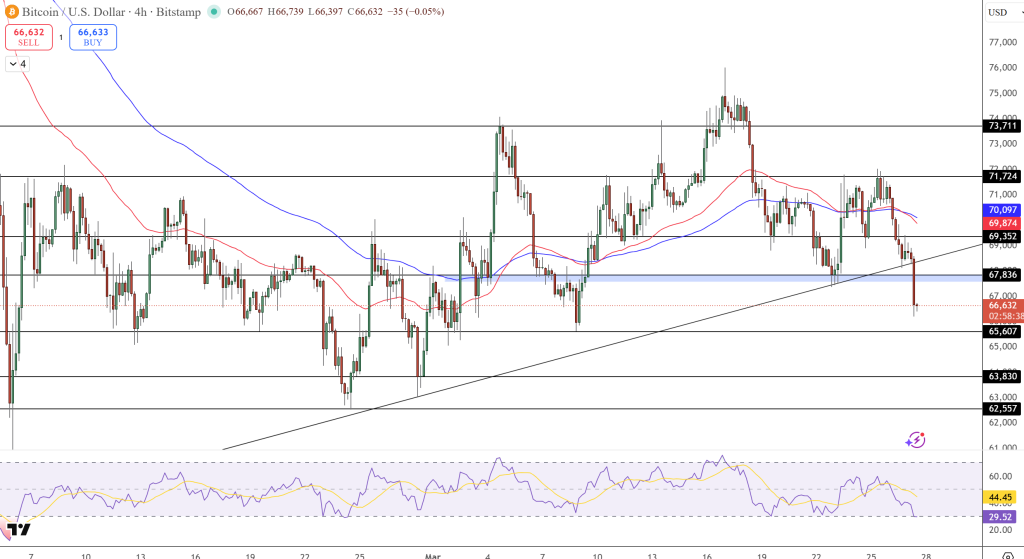
The 4-hour chart has shown a steady decline.
Between March 17 and 19, Bitcoin formed a sharp three black crows pattern, falling from $74,000 to $69,352. Since then, each rebound has been weaker, with the long-term EMA now acting as resistance around $70,097 and stopping every recovery attempt.
Today, Bitcoin broke through both the $67,836 support and the rising trendline that connected the January low near $62,500 and the February higher low at $63,830. Losing months of bullish trendline support in one move is a big deal. Now, Bitcoin is below both EMAs and does not have a clear short-term support level.
There is one positive sign: the RSI is getting close to oversold levels on the 4-hour chart. In the past, this has often led to strong bounce-backs. If the price steadies and RSI forms a higher low while testing $65,607 to $63,830, that bullish divergence could be the long entry signal swing traders are waiting for.
Trade idea (long from support): Buy if you see a bullish engulfing or hammer pattern at $63,830 to $65,607. Place your stop below $62,500. Aim for $69,352 first, then $71,724 if the price recovers further.
The Structural Bull Case Has Not Changed
Even with the recent drop, institutional interest remains strong. BlackRock’s IBIT now holds 784,062 BTC. US spot Bitcoin ETFs saw $340 million in net inflows last week, marking the third week in a row of positive flows. On March 25, Bernstein repeated its $150,000 price target and called this correction the weakest bear case in Bitcoin’s history.
CryptoQuant analyst JA Maartun points out that in past cycles, bottoms have formed about 777 days after the halving. This suggests a possible floor in late May 2026, with the broader cycle bottom likely between June and December 2026.
The $66,000 level is the next key area to watch. If Bitcoin breaks below it, the price could quickly move toward $63,830. If it holds and RSI shows divergence, this selloff could turn into the buying opportunity bulls have been waiting for.
FAQ: Bitcoin Crash – What Traders Need to Know
Why is Bitcoin dropping on March 27, 2026?
Several events happened at once: a $14.16 billion options expiry on Deribit, $300 million in leveraged long liquidations, Iran rejecting peace talks which pushed oil above $100, and Treasury yields nearing 4.5%. This combination caused a wave of forced selling that went beyond normal market pressures.
What is the main support level for Bitcoin right now?
$63,830 is the key technical floor, as it was the higher low in February and the base of the trendline that broke today. Below that, $62,500 is the January low and the stop level for long trades. If Bitcoin stays below $62,500, it would be a major structural change.
Is this a Bitcoin buying opportunity?
The long-term case remains intact — BlackRock’s IBIT holds 784,062 BTC, ETF inflows have been positive three consecutive weeks, and Bernstein maintains a $150,000 target. Near-term, wait for RSI divergence confirmation at $63,830–$65,607 before entering. Catching a falling knife without confirmation is the most common mistake in a liquidation-driven selloff.
- Check out our free forex signals
- Follow the top economic events on FX Leaders economic calendar
- Trade better, discover more Forex Trading Strategies
- Open a FREE Trading Account
- Read our latest reviews on: Avatrade, Exness, HFM and XM
Related Articles


Sidebar rates
Related Posts
