PayPal Stock Down Nearly 88%: Is a Massive Recovery Rally Finally in Sight?

Quick overview
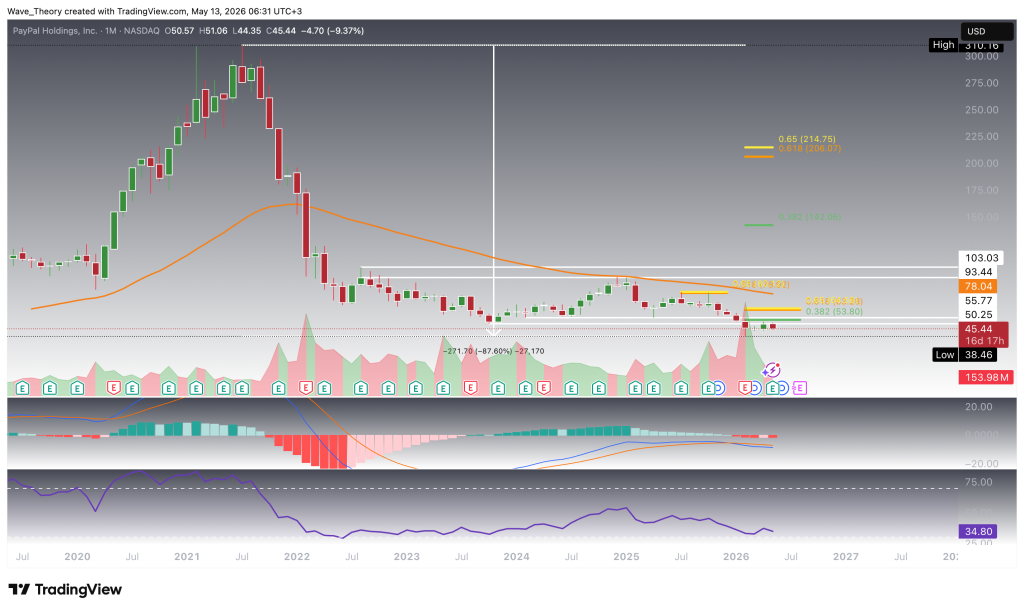
- PayPal stock has declined nearly 88% since its all-time high in 2021, raising questions about whether the worst has been priced in.
- The stock continues to show predominantly bearish indicators, with a recent rejection at Fibonacci resistance leading to a 15% decline.
- Key support is identified at the golden ratio level near $43, while resistance levels to watch include the 50-day EMA at $47.8 and Fibonacci resistance at $53.8.
- Despite the bearish trend, there are early signs of momentum improvement, suggesting a potential relief bounce if key support levels hold.
Will PayPal Stock Bounce Off the Next Golden Ratio Support?
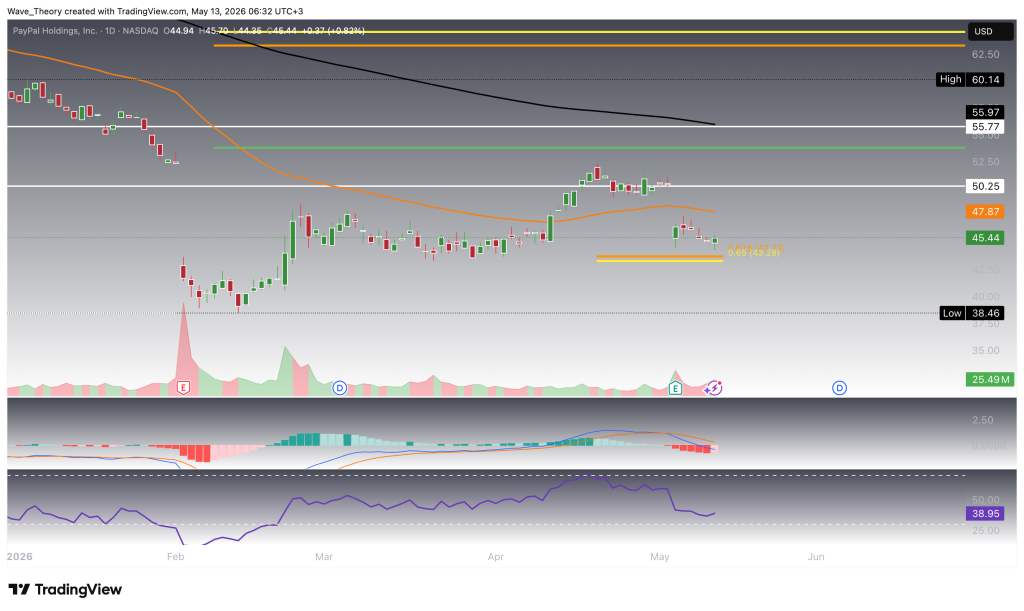
On the daily timeframe, PayPal’s technical structure reflects a similarly cautious outlook, with indicators still leaning bearish overall. The EMA configuration has formed a death cross, confirming the prevailing downtrend across the short- to medium-term horizon. In addition, the MACD lines remain in a bearish crossover setup, although the MACD histogram has begun to tick higher today, suggesting early signs of improving momentum. Simultaneously, the RSI remains neutral and does not yet provide a decisive directional signal. For now, PayPal has an opportunity to stabilize and bounce from the significant golden ratio support near $43, which would help preserve the recent upward recovery move. Should that support hold, the next major resistance levels are located at the 50-day EMA near $47.8 and the 200-day EMA near $56.
Mixed Signals Emerge on the 4H Chart
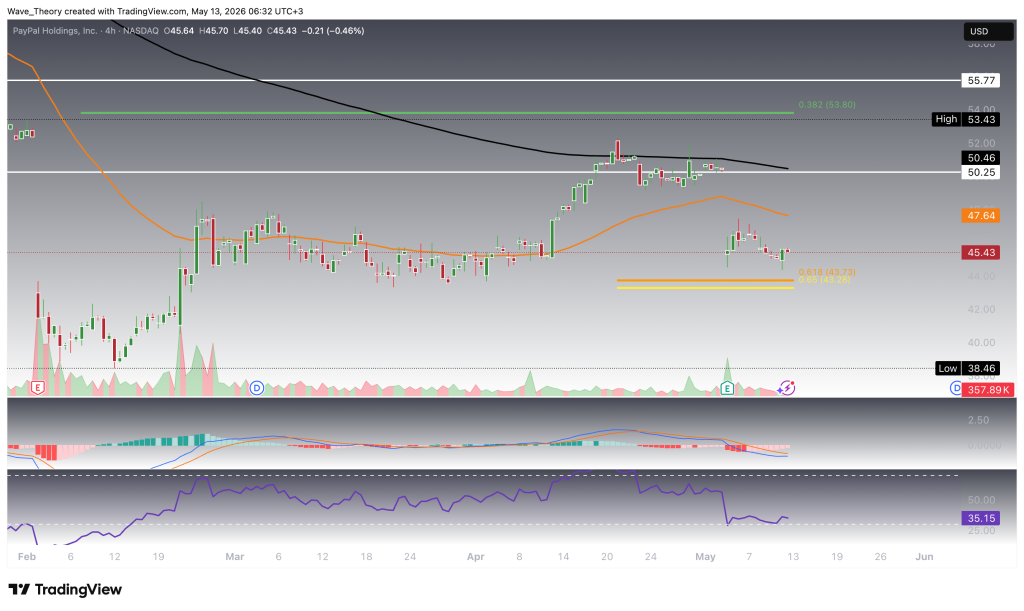
On the 4-hour timeframe, PayPal continues to show a mixed technical structure with bearish trend signals offset by tentative momentum improvement. The EMA configuration has also formed a death cross, confirming the prevailing short-term downtrend. In addition, the MACD lines remain in a bearish crossover, reinforcing downside pressure. However, the MACD histogram has been trending higher, indicating that bearish momentum may be weakening and that a near-term recovery attempt remains possible. Meanwhile, the RSI remains neutral and offers neither a bullish nor bearish directional bias. As long as PayPal continues to hold above the key golden ratio support near $43, the stock retains some upside potential despite the broader bearish backdrop.
PayPal Stock Outlook: Key Levels to Watch Amid Bearish Trend
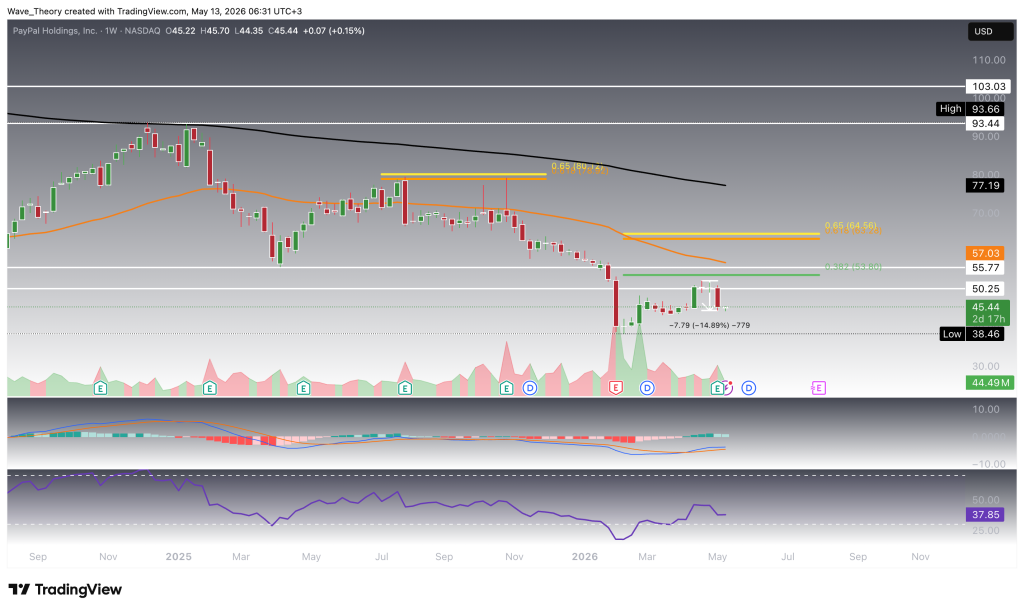
PayPal remains in a broader bearish trend across the monthly, daily, and 4H timeframes, with death crosses on lower timeframes and predominantly bearish MACD structures signaling continued downside pressure. However, momentum indicators show early stabilization, as the MACD histogram has started to improve on the daily and 4H charts, suggesting a potential relief bounce if key support levels hold. Immediate support sits at the golden ratio level near $43, followed by the February low at $38.46. A break below that zone could open the door to fresh cycle lows. On the upside, initial resistance stands at the 50-day EMA near $47.8, followed by Fibonacci resistance at $53.8, the 200-day EMA near $56, and the next major resistance at $64. If PayPal breaks above those levels, upside targets emerge at the 50-month EMA near $78, the golden ratio resistance near $80, and the broader historical resistance zone between $93.5 and $103. Overall, the trend remains bearish unless PayPal can reclaim and sustain a move above the major resistance cluster.
- Check out our free forex signals
- Follow the top economic events on FX Leaders economic calendar
- Trade better, discover more Forex Trading Strategies
- Open a FREE Trading Account
- Read our latest reviews on: Avatrade, Exness, HFM and XM
Related Articles
Sidebar rates
