Berkshire Hathaway (BRK.B): Is Its $400B Cash Pile Warning of a Market Crash?
Quick overview
- Berkshire Hathaway's stock has been consolidating about 11% below its all-time high of $542.07, indicating a potential upcoming resolution.
- The company's recent earnings report showed solid operating earnings growth, but net income fell slightly short of expectations.
- Berkshire's cash reserves reached a record $397 billion, raising questions about management's cautious approach to current market valuations.
- Technical indicators present mixed signals, with improving momentum on shorter timeframes but cooling momentum on the monthly chart.
Berkshire Hathaway has spent the better part of a year doing what it does best – refusing to do anything dramatic. After printing an all-time high of $542.07, the stock has settled into a tightening sideways range roughly 11% below that peak, with price action compressing between the support at $476.95 support and $491.67 for months. This is not a breakdown and not a breakout – it is a coiling spring, and the technical picture suggests the resolution is approaching.
Berkshire Hathaway Earnings Report
Berkshire’s most recent earnings report landed on May 2, 2026 – a milestone release, marking the first full quarter under CEO Greg Abel, who succeeded Warren Buffett on January 1. The numbers were characteristically solid: operating earnings rose nearly 18% year-over-year to $11.35 billion, though the figure came in slightly below the $11.56 billion consensus. Net income attributable to shareholders more than doubled to roughly $10.1 billion.
Insurance underwriting was the standout, contributing $1.72 billion – up 28% year-over-year -even as GEICO posted a 34% earnings decline within the segment. BNSF added $1.38 billion, up from $1.21 billion a year earlier.
The headline number, however, was the cash: Berkshire’s war chest swelled to a record $397 billion, up from $373 billion at the end of 2025, as the company remained a net seller of equities to the tune of $8.1 billion in the quarter. The market’s read is double-edged – unmatched optionality on one side, and a conglomerate that sees little worth buying at current valuations on the other. That tension is precisely what the chart’s indecision reflects.
Stuck 11% Below the All-Time High
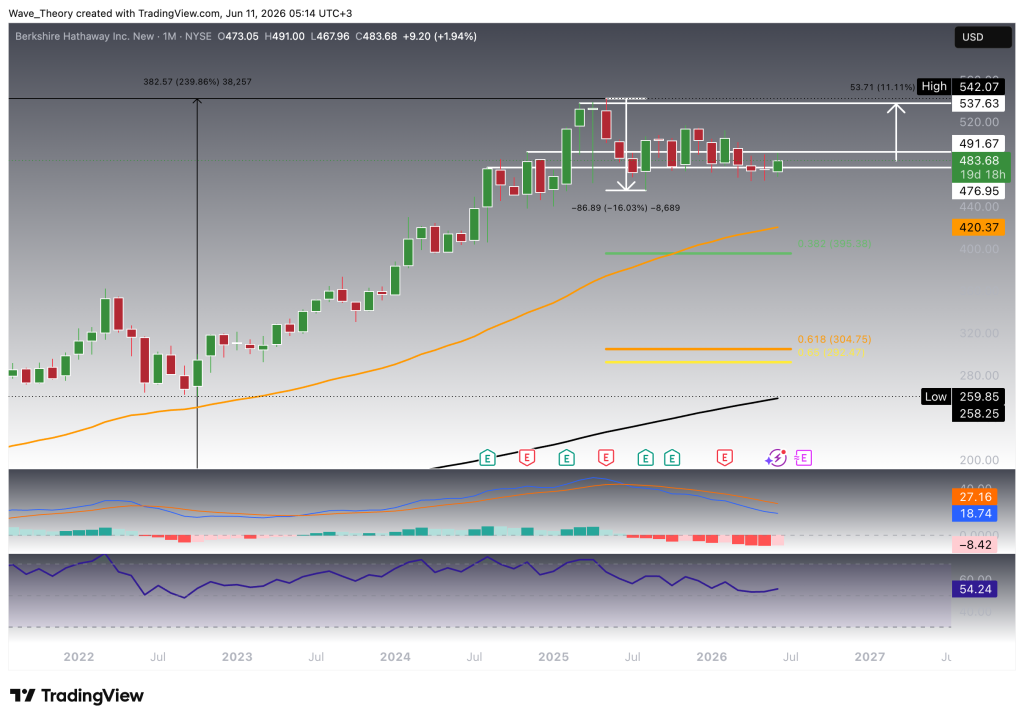
On the monthly chart, Berkshire’s structure remains constructive but cooling. Price sits just below the middle of the post-peak range, and the measured-move projection from the consolidation points toward $537.63 — upside of roughly 11% – if the range resolves higher.
Momentum, however, is the warning sign on this timeframe. The MACD lines remain in positive territory, but a bearish crossover is in place and the histogram has been printing progressively deeper red bars until this month, confirming that long-term upside momentum continues to bleed. The RSI has slipped to 54.24 and trends lower – still above the midline, but a clear step down from the readings that accompanied the 2024–2025 advance. The first major dynamic support sits far below at the 50-month exponential moving average near $420.37, with the 0.382 Fibonacci retracement at $395.38 beneath it.
The EMAs still display a golden crossover on the monthly chart, which confirms the trend bullishly in the long-term. Moreover, the MACD histogram has started to tick bullishly higher this month.
Weekly Chart: Compression Around the 50-Week EMA
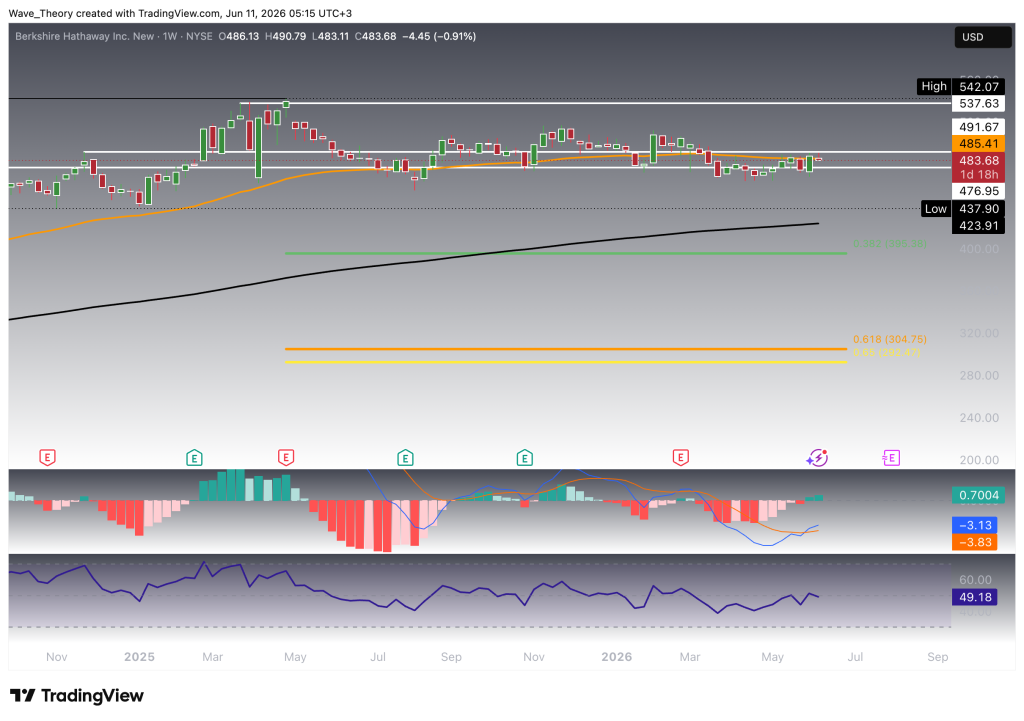
The weekly chart shows the consolidation in its cleanest form. Price at $483.68 is pressing directly against the 50-week exponential moving average at $485.41 — a level the stock has been oscillating around for months without committing to either side.
The momentum picture here is quietly improving: the MACD lines, while still marginally below zero, have produced a bullish crossover, and the histogram has flipped positive at +0.70 – the first sustained green prints since the corrective phase began. The RSI sits at a perfectly neutral 49.18. This is the signature of a market in equilibrium, with the first early evidence that the balance is tilting upward.
Should the range break down instead, the key weekly supports are the $464 area, the prior swing low at $437.90, and the 200-week moving average at $423.91 – which has not been tested in years. Should these support levels fail to hold, the next important golden ratio support is positioned at $300.
Daily Chart: Price Battles the 200-Day From Below
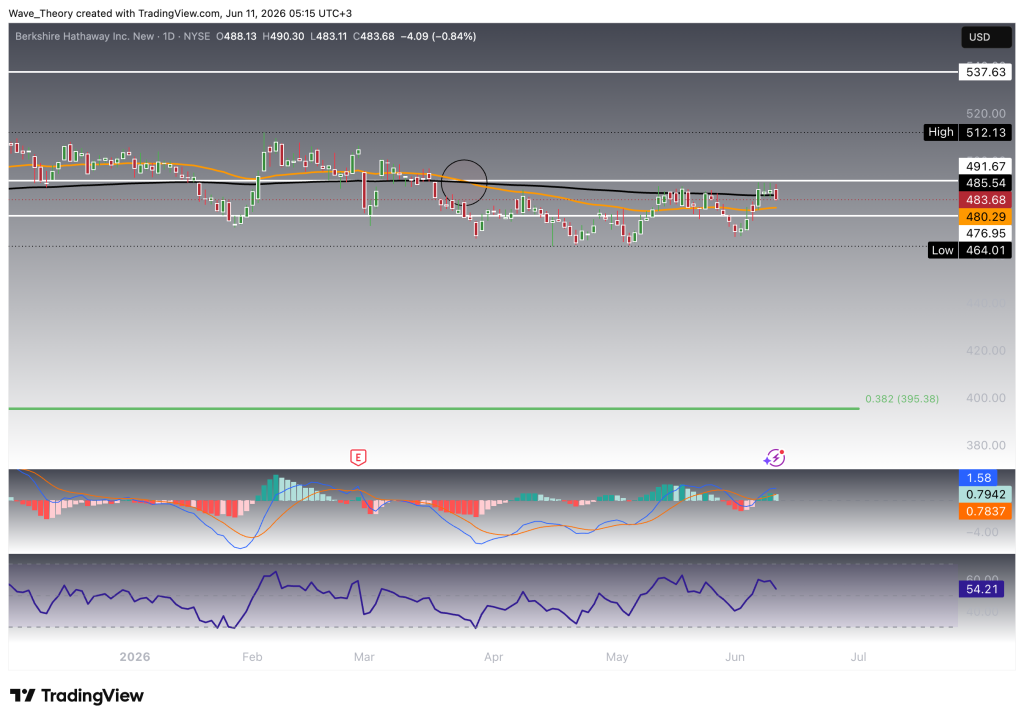
The daily chart frames the immediate battle. Berkshire trades above its 50-day exponential moving average at $480.29 but remains capped by the 200-day exponential moving average at $485.54 – and the earlier bearish crossover between the two averages (a death cross formed during the spring weakness) has left both lines flat and intertwined, mirroring the broader indecision.
Momentum has turned conflicting: the MACD lines have crossed bullishly above the zero line with the histogram printing a lower bar today, and the RSI at 54.21 has pushed back above the midline. The sequence of higher lows since the $464.01 swing bottom adds to the case that buyers are slowly gaining control inside the range.
The setup is clean: a daily close above the $485.50 confluence – where the 200-day and the 50-week averages stack – would put the $491.67 range top in immediate focus.
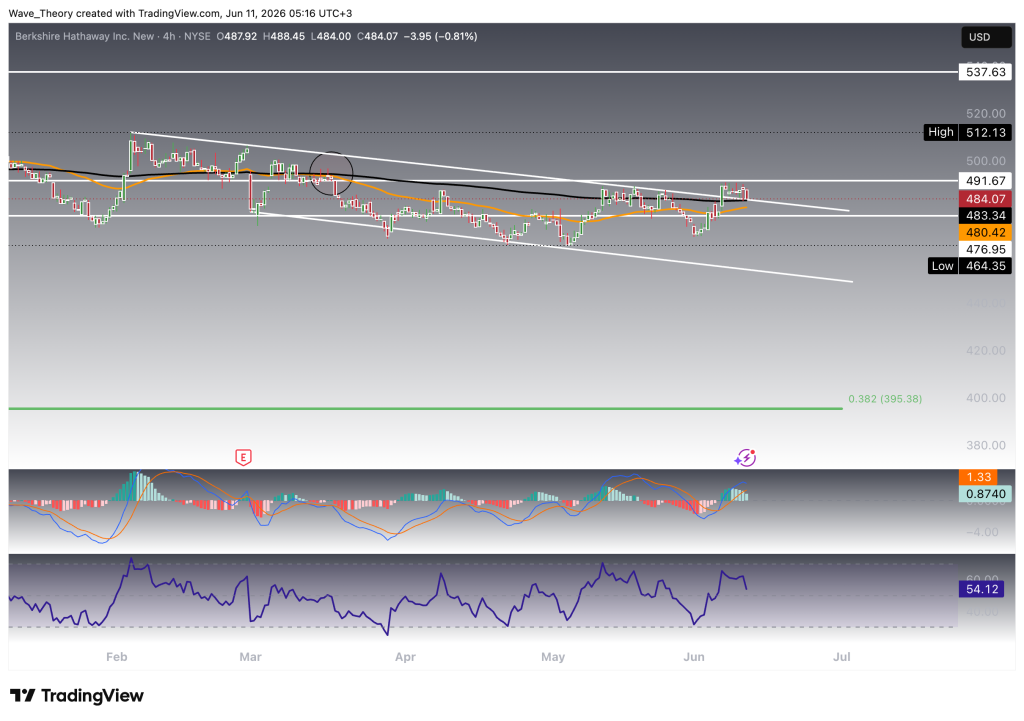
4H Chart: Testing the Upper Boundary
The 4-hour chart paints the most constructive picture of all four timeframes. Price has been carving out a descending broadening structure since the $512.13 high, and the most recent advance has pushed the stock into the upper boundary of that formation – above the 50-period EMA at $480.42 and pressing against the 200-period EMA near $485.50.
The MACD lines remain bullishly crossed with the histogram trending lower, while the RSI at 54.12 holds above the midline without approaching overbought extremes – leaving room for an impulsive move if the breakout attempt succeeds.
A confirmed 4H close above the channel’s upper line and the $485.50 moving-average cluster would be the first actionable signal that the larger range is resolving to the upside. Then, Berkshire Hathaway stock could target the ath at $542.
BRK.B Stock Analysis Summary & Key Levels
Berkshire Hathaway (NYSE: BRK.B) is in a textbook compression phase – consolidating roughly 11% below its $542.07 all-time high while the timeframes send deliberately mixed signals: cooling momentum on the monthly, neutrality with early bullish hints on the weekly, and fresh bullish MACD crossovers on both the daily and 4H charts.
The immediate pivot is the $485.41–485.54 confluence, where the 50-week and 200-day moving averages converge directly overhead. Above that, resistance sits at the $491.67 range top, followed by the $512.13 swing high and the record zone between $537.63 and $542.07. A confirmed breakout above $491.67 activates the measured-move target near $537.63 — roughly 11% above current levels.
To the downside, initial support rests at the 50-day moving average near $480.29, followed by the range floor at $476.95 and the swing low at $464.01. Below that, the deeper supports are the $437.90 weekly low, the 200-week moving average at $423.91, and the 50-month moving average at $420.37, with the 0.382 Fibonacci retracement at $395.38 marking the boundary of the long-term bullish structure.
Overall, the longer the range tightens, the more energy builds behind the eventual resolution. As long as BRK.B holds above $476.95, the improving momentum on the lower timeframes gives the bulls the slight edge — but the real signal arrives only with a decisive close above $491.67 or below $476.95. Until one of those levels gives way, patience is the position.
Market Crash Warning Signs
Berkshire’s nearly $400 billion war chest may be the most interesting figure of all. Buffett and his team are effectively sitting on a mountain of dry powder while broad equity valuations remain historically elevated. The message may be simple: they are finding very few bargains. With Berkshire accumulating liquidity at a pace never before seen in its history, some investors wonder whether management is preparing for a period of severe market dislocation. Is this merely disciplined patience, or a warning that the greatest value investor of all time sees risks ahead that the broader market continues to ignore?
- Check out our free forex signals
- Follow the top economic events on FX Leaders economic calendar
- Trade better, discover more Forex Trading Strategies
- Open a FREE Trading Account
- Read our latest reviews on: Avatrade, Exness, HFM and XM
Related Articles


Sidebar rates
Related Posts
