Bitcoin Bounces Back Above $63,700 as Mideast Ceasefire News Calms Markets
Bitcoin had a good Friday. It climbed about 2.4%, touching $63,770 before settling back near $63,600, clawing back some of what it lost...
Quick overview
- Bitcoin rose about 2.4% on Friday, reaching $63,770 before settling near $63,600, recovering from a previous decline earlier in the week.
- The positive shift in sentiment was influenced by a ceasefire deal between Israel and Hezbollah, which alleviated some market fears.
- A significant options expiry of nearly $10.6 billion is approaching, which could drive Bitcoin prices upward as traders adjust their positions.
- Institutional investments remain uncertain, with US spot ETFs experiencing continued outflows, while technical indicators suggest potential upward movement if key resistance levels are breached.
Bitcoin had a good Friday. It climbed about 2.4%, touching $63,770 before settling back near $63,600, clawing back some of what it lost earlier in the week. The setback had been real: BTC fell roughly 7% from its June 15 high of $67,200 down to $62,300 on June 18, a stretch that coincided with ETF money walking out the door and a broader rush away from anything risky.
The mood changed when word came through that Israel and Hezbollah had struck a ceasefire deal, due to take effect Friday. Reuters got confirmation from a US official, and Iranian officials hinted they would be willing to get back to the table with Washington if the agreement sticks. None of that solves anything permanently, but it was enough to take some fear out of the room. Oil dropped sharply on the news, heading for an 8% weekly decline, and gold and silver both slipped as money rotated back toward riskier bets.
There is also a derivatives angle worth knowing about. A chunky options expiry, close to $10.6 billion, lands on June 26, and a good chunk of that open interest sits above where bitcoin is trading right now. That alone tends to pull price upward as expiry approaches. On top of that, short sellers got squeezed once bitcoin bounced out of oversold territory from the June 18 low, and covering those positions added more fuel to the move. Liquidation data from CoinGlass shows a thick cluster sitting just above current prices, between $64,000 and $65,000, with another pocket near $66,000 that could speed things up if it gets triggered.
Institutional money is still sending mixed signals. US spot ETFs lost another $226 million net this week, according to SoSoValue, continuing a stretch of outflows that has run since mid-May. The pace has eased compared to the worst of it in late May and early June, but it has not flipped positive yet.
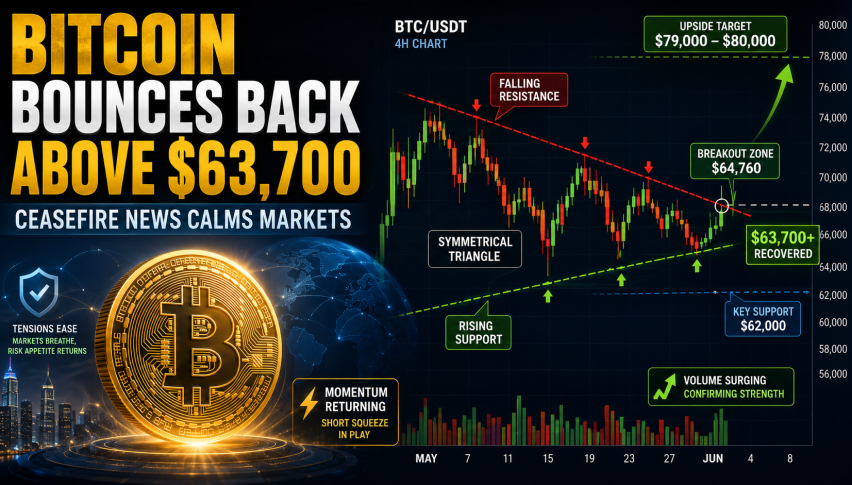
The chart backs up the recovery story too. On the four-hour timeframe, bitcoin has been squeezing into a symmetrical triangle, with a falling resistance line from the June 15 peak meeting a rising support line off the June 5 low. A real break above $64,760 would clear both that triangle and a key Fibonacci level, and the pattern itself points toward $79,000 to $80,000 if that happens. The daily chart agrees for now. MACD has printed higher readings for a few sessions straight, and RSI has worked its way back above 38 after flirting with oversold levels.
None of this holds if bitcoin slips back under $62,000. That would break the triangle’s support and open the door toward the June low near $59,200, where another wall of liquidity sits waiting. For now, traders are mostly watching three things: whether the Mideast ceasefire holds, what the Fed signals next, and whether ETF flows finally turn the corner.
- Check out our free forex signals
- Follow the top economic events on FX Leaders economic calendar
- Trade better, discover more Forex Trading Strategies
- Open a FREE Trading Account
- Read our latest reviews on: Avatrade, Exness, HFM and XM
Related Articles


Sidebar rates
Related Posts
