British Pound to Face UK Inflation Data on Tuesday
After the British pound’s massive decline before and after the Brexit, it stumbled once more early on the 7th of October when a flash crash took it down several hundred pips in the Asian session. Since then, the pound has gained some traction again. At the moment the GBP/USD is 770 pips above the flash crash low. It’s amazing how quickly market sentiment can change! A few factors which supported the pound stepped in which changed the way investors valued the pound in the blink of an eye, so to speak. The Bank of England’s fear of overshooting their inflation target were one of them. Donald Trump’s election as the new US president also helped the pound. Finally, the prospects of a ‘soft Brexit’ also enticed investors to trust in the pound once again. As you might know, there were talks of the possibility that the UK could access the European single market at a cost.
On Monday the pound advanced against the US dollar. Perhaps investors are loading into some long pound positions in anticipation of a higher than expected inflation reading on Tuesday. Let’s look at a few charts:
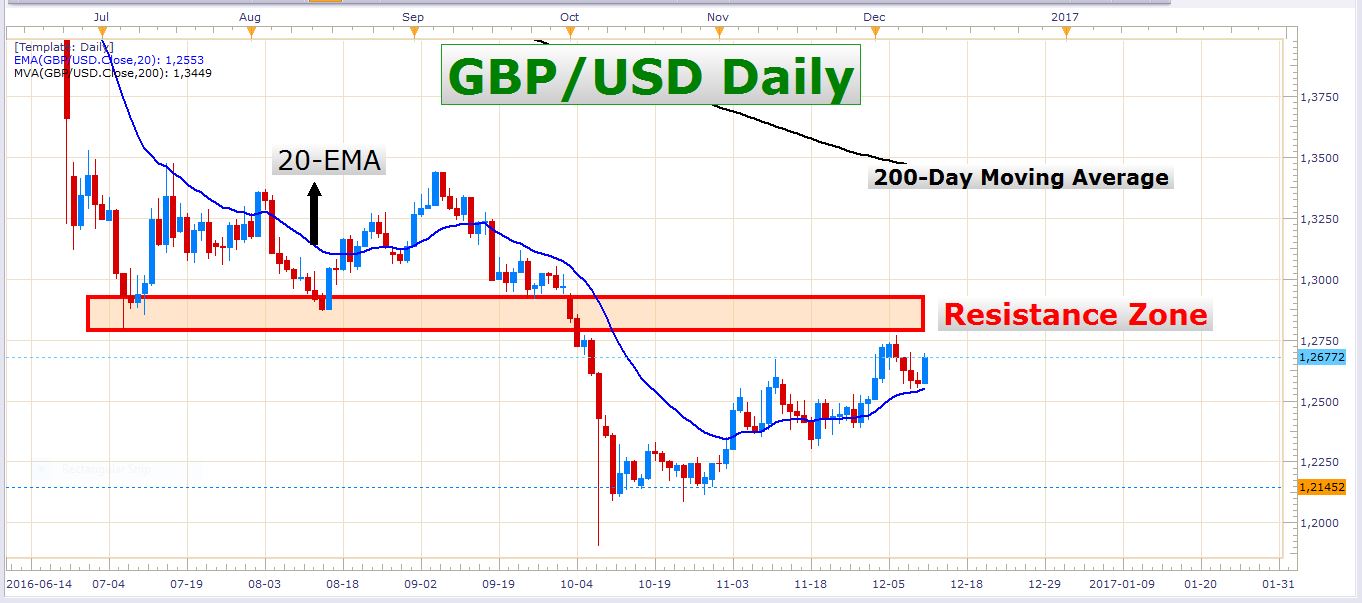 GBP/USD Daily Chart
The long-term picture is bearish while the short-term momentum is bullish. The pair has already bounced off this red resistance zone on the chart above. On the other hand, the rate has recently found support at the 20-day exponential moving average. Although I don’t like to go against the long-term downtrend, I can’t help to like the topside at the moment. It seems as if there is a lot of value to be found in the pound at the moment. Think about it this way, the pound started trading lower long before the Brexit vote was captured. Then the pound lost tremendous value on the day of the Brexit vote and continued to lose value until the recent flash crash. It appears that the Brexit might not take such a massive toll on the UK economy after all. As mentioned earlier, the UK might be able to still participate in the European single market at a cost, which would spare the UK massive financial losses.
This red resistance zone on the chart above is critical. A breach and close above this zone could open up the way to the 200-day moving average. This moving average is an important barometer by which traders and investors gauge the prevailing trend of a financial instrument. It could also be an important resistive factor to the price.
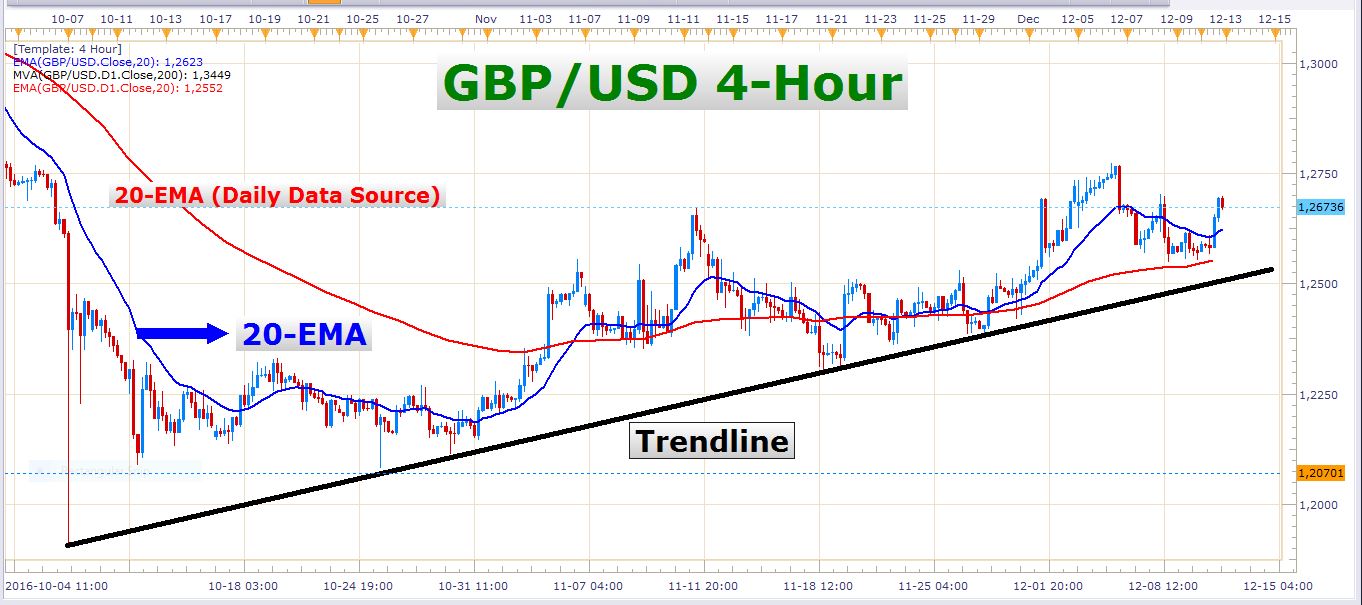 GBP/USD 4-Hour Chart
On this 4-hour chart, it is easy to discern the persistent bullish momentum on the GBP/USD. It is interesting how this rising trendline has offered great buying opportunities on numerous occasions in the last few weeks. This might also be an important support level which could be a tall hurdle to clear for the bearish market players in the case of a decline in the exchange rate.
My short-term outlook for the pair is bullish as long as we hover above the 20-EMA on the hourly and 4-hour charts. There hasn’t been strong, and impulsive market direction in the last few trading days, but perhaps the UK CPI numbers on Tuesday will rock the pound out of its bearings.
The US dollar gave back some of its gains today. It looks like the market is not too optimistic about buying the Greenback in the last few days leading into the FED’s interest rate decision. Now if the US dollar were to slide on Wednesday when the FED decides about a suitable interest rate, the British pound could be the perfect currency to sell the US dollar against, especially if the UK inflation readings come in higher than expected on Tuesday.
GBP/JPY
If you’re looking to trade the pound without touching the US dollar, the GBP/JPY could fill up your pockets. This pair is currently riding the wave of tremendous bullish momentum. Although this pair has advanced more than 2000 pips from the yearly low that was set on the 7th of October, it could easily make further upward progress.
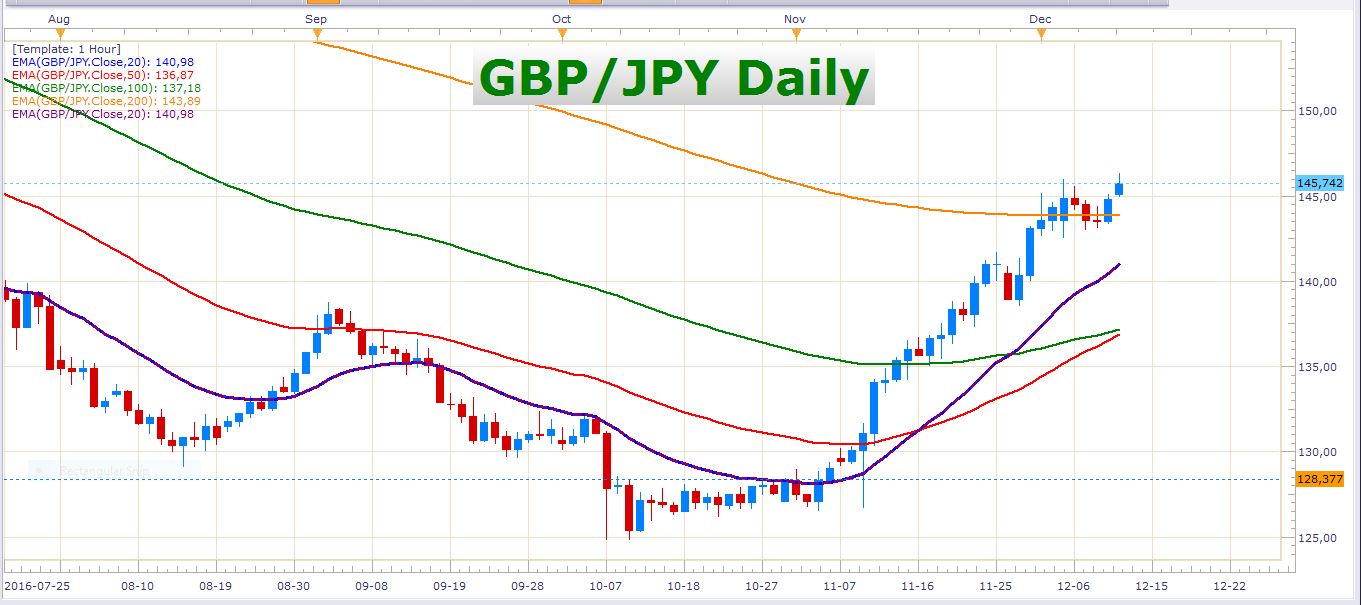 GBP/JPY Daily Chart
What a mighty advance! The pair traded to fresh highs on Monday, and perhaps it will continue doing so in the days and weeks to come. I will be on the lookout for intraday opportunities on this pair over the next few days.
USD/JPY
Selling the Yen has yielded some handsome profits recently! Some of my favorite pairs to sell the Yen against include the Australian dollar, Canadian dollar, US dollar, New Zealand dollar, and, of course, the British pound. Let’s look at the USD/JPY:
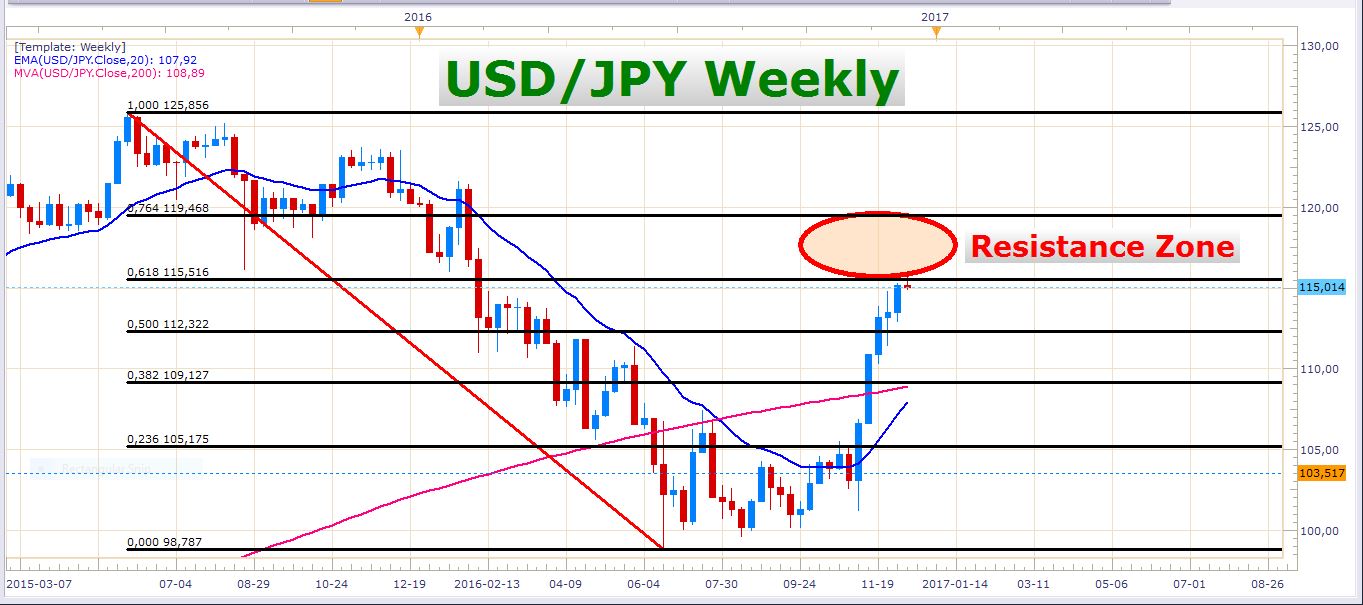 USD/JPY Weekly Chart
On this chart, you can see how the price just stabbed into the 61.8% fib resistance area. This could be an important level for the bulls to clear if they want to push the rate much higher. This fib level is also at an important former support level which also adds to the resistive properties of this particular zone.
If we look past the possibility of adjacent resistance, the magnificent bullish momentum appeals much to the intraday trader and the swing trader. Let’s look at a 4-hour chart:
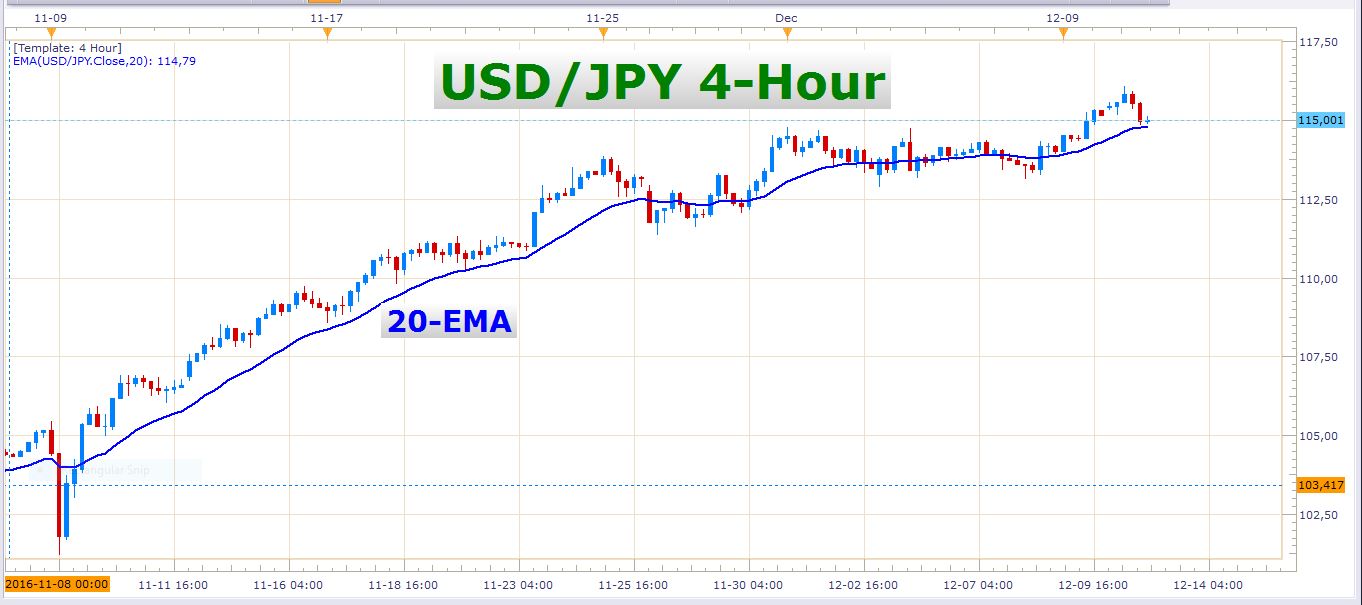 USD/JPY 4-Hour Chart
The last thing we want to do is fight this strong trend. The bullish momentum is firmly intact, and perhaps this pair will break to multiple new highs in the week to come.
Take heed to this week’s FED rate decision, and be aware that it will definitely have an effect on Tuesday’s trading. Sometimes the market movement is limited because of low participation. Currency movements could also be less predictable because of thinner liquidity leading into this event.
Have a magnificent trading day!
- Check out our free forex signals
- Follow the top economic events on FX Leaders economic calendar
- Trade better, discover more Forex Trading Strategies
- Open a FREE Trading Account
- Read our latest reviews on: Avatrade, Exness, HFM and XM
Related Articles


Sidebar rates
Related Posts
