March 23rd Morning Brief – Finally The U.S Dollar Hits Support
We are sure to have another exciting day ahead after some interesting analysis of the Gold and WTI crude oil. As of yesterday, the market has been trading sideways, particularly the Gold, which is consolidating in a narrow trading range of $1244 – 1251.18. However, due to lack volatility, the market has not shown many trading opportunities. Unfortunately no volatility means no trades as we are unsure which side the market will go, especially in the absence of major economic events.
Later in the New York session, the Official Cash Rate from the RBNZ came into focus. Nevertheless, it came with a muted impact on the NZD pairs as the central bank kept the rates unchanged at 1.75%.
A Quick Review – U.S Dollar Index
Over the previous week, the U.S dollar index has traded sharply bearish and continued with its bearish momentum for 5 consecutive trading days. But now, it seems like the sellers are becoming exhausted for a number of reasons.
.jpg)
U.S Dollar Daily Outlook
Let's have a look at the technical outlook on a daily chart.
Firstly, according to the leading indicator, Stochastics (below 20), the Dollar index has already entered into oversold territory and investors may hesitate to enter further sell positions before taking initial profits.
Secondly, we can see a major trendline extending support to the U.S Dollar at $12265.
Lastly, the spinning top candlestick formation right above the trendline support is providing strong evidence that selling bias is not strong anymore. Hence, we can expect pullbacks in the Dollar. Yet, if the market breaks below the trendline support, then it's better for us to buckle up for the next ride.
Major Economic Events To Watch Today
GBP
- MPC Member Broadbent Speaks (10:15)
- Retail Sales m/m (10:30)
EUR
- Long Term Refinancing Operation (Tentative)
USD
- Unemployment Claims (13:30)
- Fed Chair Yellen Speaks (13:45)
- New Home Sales (15:00)
- FOMC Member Kashkari Speaks (17:30)
CHF
- Gov Board Member Maechler Speaks (18:00)
NZD
- Trade Balance (22:45)
EUR/USD – The Most Traded Currency Pair
Indeed, the Euro as the single currency, is in focus due to optimistic fundamentals. However, yesterday it failed to extend gains despite worse than expected existing home sale figures. We know the reason, right?
Yup – it's because of the supported U.S Dollar.
However, we have several economic events from the Eurozone, that are likely to shake the long term outlook of the economy. Stronger figures will definitely place some pressure on the ECB's President Mario Draghi to consider tapering their bond buying program.
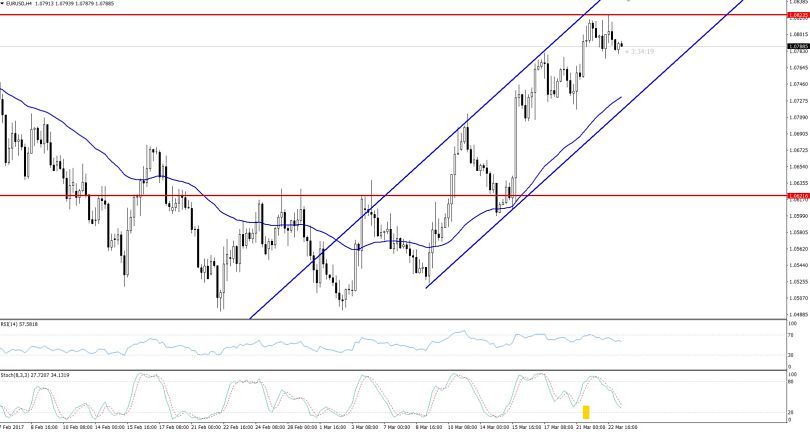
EURUSD – Hourly Chart
Technical Outlook
The 4-hour chart of the EUR/USD provides a clear bullish signal. For example, the price is above 50 periods EMA and the RSI holds at 57, which clearly demonstrates a bullish bias from investors. In addition, it's trading in the bullish channel.
Nonetheless, I'm not feeling confident to buy it below a double top resistance level of $1.0823. Moreover, by having a closer look, we find a test bar below $1.0823 which is signaling weakness in the bullish trend.
USD/JPY – The Safe Haven Currency Pair
Today, in the Asian sessions, the Japanese Yen has pulled back slightly, but it's still staying below $111.500 – a major support became a resistance level. Previously, the Bank of Japan (BOJ) maintained its stance that inflation and economic growth will occur soon, but that global financial markets remained a big source of uncertainty in the wake of the Brexit, U.S. presidential election and now the upcoming elections in the Eurozone.

USDJPY Hourly Chart
Technical Outlook
Let me highlight that the oversold pair has now completed the 38.2% Fibonacci retracements in the 1-hour timeframe. Other than that, the 50 period's EMA is extending an additional resistance at $111.600, but the RSI is neutral at 50.
Trading Signal: Investors are recommended to keep their sell positions below $111.600 with a take profit at $111.200 (major support). However, breakage of $111.200 is likely to lead the pair towards $110.900.
- Check out our free forex signals
- Follow the top economic events on FX Leaders economic calendar
- Trade better, discover more Forex Trading Strategies
- Open a FREE Trading Account
- Read our latest reviews on: Avatrade, Exness, HFM and XM
Related Articles


Sidebar rates
Related Posts
