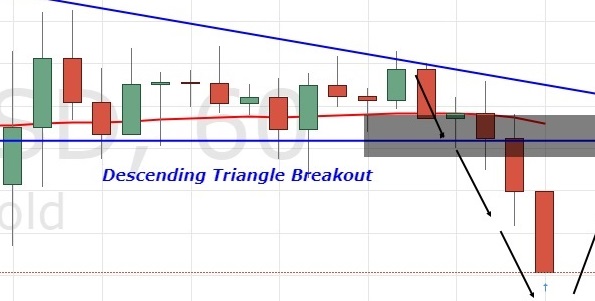
Descending Triangle Breakout In Gold – Trading Signal Update
Gold was consolidating in a descending triangle pattern, supporting the pair near $1,322. On the breakage, we decided to jump in the market.
It’s been an excellent start to the week as team FX Leaders closed four winning forex trading signals during the late Asian sessions. Our forex trading signal on Gold is also swimming in profits.
Fundamentally, the bullion market is mixed, with no clear signal as to direction, thanks to technicals for sparing an outstanding entry.
Three Reason for a Bearish Gold
Firstly, on the hourly chart, Gold was consolidating in a descending triangle pattern, supporting the pair near $1,322. On the breakage, we decided to jump in the market with a target of $1,318.20.
Secondly, Gold is trading below the 50 periods EMA, indicating a bearish bias of investors.
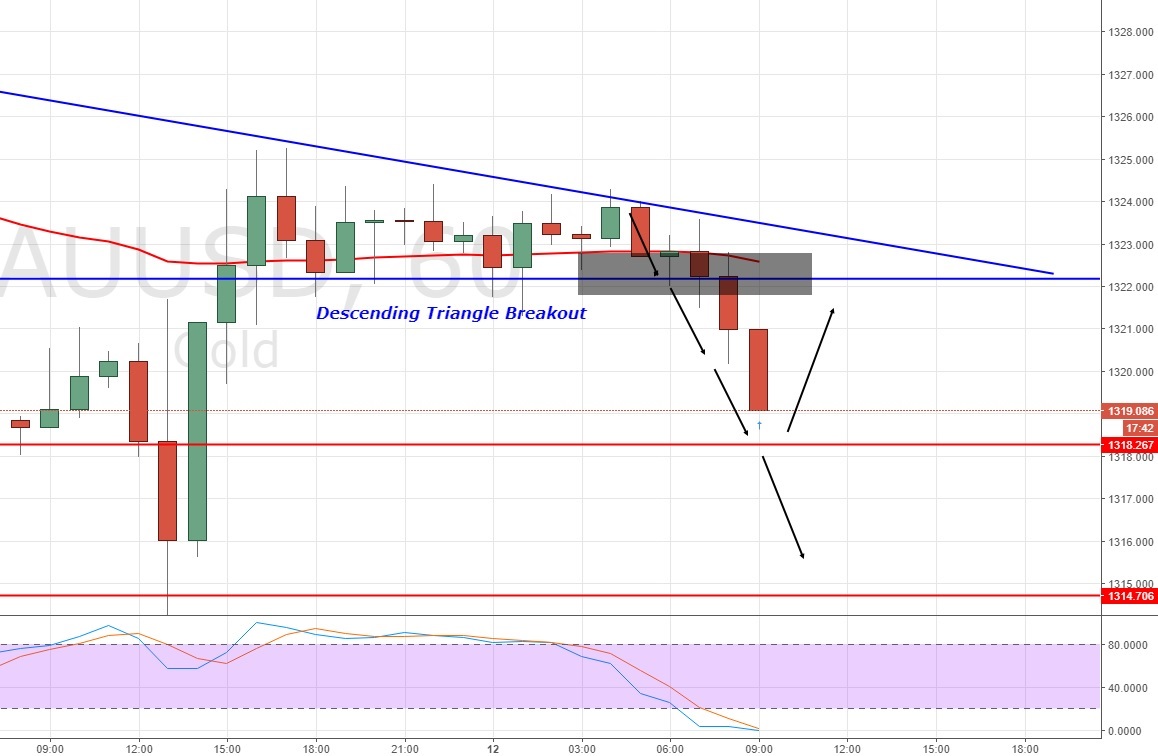
Gold – Hourly Chart – Descending Triangle Pattern
Thirdly, the leading indicators, RSI and Stochastics, had a bearish crossover. At the moment, the leading indicators are about to enter the oversold zone. We need to carefully monitor the trade to avoid bullish reversals.
Gold – XAU/USD – Trading Idea
The idea is to stay bearish below $1,322 with a stop above $1,324 and profit at $1,318. I will be looking for a buy position somewhere around $1,314. Stay tuned for our updates for quick profits.
Good luck!
- Check out our free forex signals
- Follow the top economic events on FX Leaders economic calendar
- Trade better, discover more Forex Trading Strategies
- Open a FREE Trading Account
- Read our latest reviews on: Avatrade, Exness, HFM and XM
Related Articles


Sidebar rates
Related Posts
