USD Index Facing the Top of the Range
The Dollar index USDX has been trading in a range for nearly two months now. The bottom of the range has been defined by the 200 SMA...
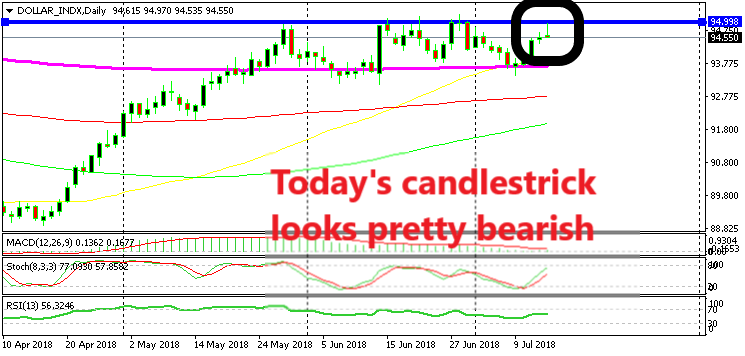
The Dollar index USDX has been trading in a range for nearly two months now. The bottom of the range has been defined by the 200 SMA (purple) on the daily chart which stands around the 93.50 level, while the top has been defined by the horizontal line at around 95.
At the beginning of this week, the USDX was trading at the bottom of thusde range. I posted an article last weekend highlighting the chart setup which looked like it was about to turn bullish. The daily candlestick back then looked like a hammer which is a reversing signal and stochastic was oversold.
Today, the opposite is forming in the USDX daily chart. The price reached the top of the range, but it failed to push above the resistance. Now, the price is pulling back lower. It seems as the resistance at 95 points has survived.
The stochastic indicator is almost overbought and it will be well overbought when the daily candlestick closes. It means that next Monday the USDX will be overbought. The daily candlestick looks like an upside down pin. The day is still young but if the candlestick closes like this, then that would be another strong bearish reversing indicator.
This means that the US Dollar should decline next week. We don’t know what will happen exactly, we are not prophets, but the technical analysis points down for next week. Although, fundamentals are very important nowadays, so we will have to see what’s coming up fundamentally next week.
- Check out our free forex signals
- Follow the top economic events on FX Leaders economic calendar
- Trade better, discover more Forex Trading Strategies
- Open a FREE Trading Account
- Read our latest reviews on: Avatrade, Exness, HFM and XM
Related Articles
Sidebar rates
Related Posts
