Higher Lows and A Head and Shoulder Pattern Forming in Bitcoin
Cryptocurrencies have been trading on a bearish trend for quite a long time. Bitcoin started turning bearish at the end of last year and sin
Cryptocurrencies have been trading on a bearish trend for quite a long time. Bitcoin started turning bearish at the end of last year and since then it has been one-way traffic for it and all major cryptocurrencies.
You can see that the trend on the daily chart has unfolded in waves, as trends usually do. The pullbacks have been pretty weak while the bearish moves have been quite strong and much larger. But, the last retrace higher at the beginning of this month was similar in size to the previous bearish move. The price formed two bullish daily candlesticks at the end of June and in continued higher until it got close to the 50 SMA (yellow).
This was a sign that the sellers were exhausting. Another sign is the break of the $6,000 level and the return above it again. This area had provided support before and it was holding on well, but it was broken towards the end of June.
Although, the sellers couldn’t hold on below it for too long and a strong bullish move followed. That was a sign that the big money was after some weak stops and once they got flushed as Bitcoin slipped below $6,000, the sellers lost interest on the downside.
The last bearish move which happened last week, couldn’t stretch below the $6,000 level, as it would normally do if the downtrend was to continue. Instead, Bitcoin formed a couple of doji candlesticks which are reversing signals.
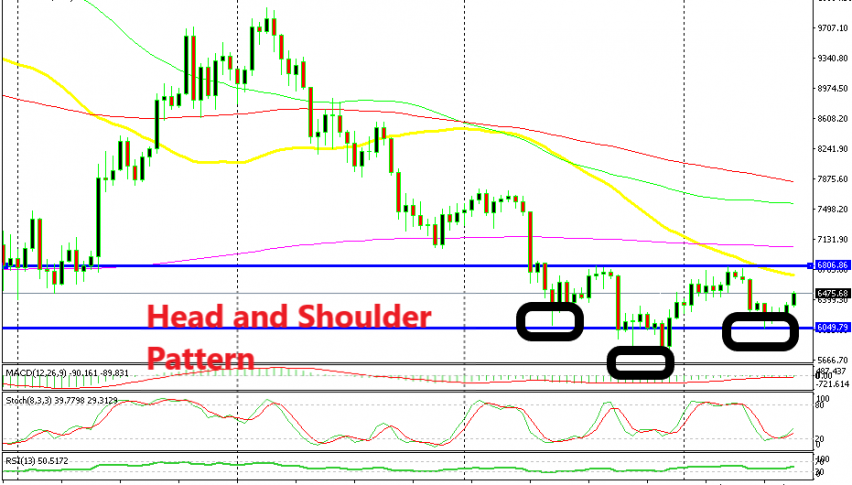
It started a bullish move after those two candlesticks and looks like Bitcoin is on a bullish trend right now. So, if there aren’t new lows, then the downtrend should be over or close to being over. The daily Bitcoin chart now looks like it is forming an inverted head and shoulders now, although, the resistance at $6,800 should be broken so this could be considered a trend reversal. If the head and shoulders pattern works out, then the target should be $7,800. Although, there is the resistance level and a couple of moving averages to be broken, so let’s see how things work out for Bitocin.
Bullish Chart Setup
- Higher lows
- Support at $6,000
- Bullish reversing candlesticks
- Inverted head and shoulder pattern
- Stochastic oversold
- Check out our free forex signals
- Follow the top economic events on FX Leaders economic calendar
- Trade better, discover more Forex Trading Strategies
- Open a FREE Trading Account
- Read our latest reviews on: Avatrade, Exness, HFM and XM
Related Articles

Sidebar rates
Related Posts
