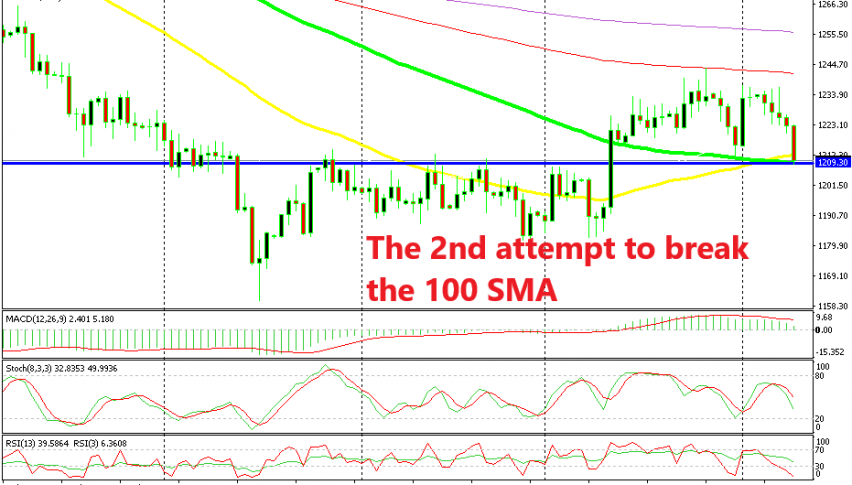
Gold Faces the 100 SMA Again As it Turns Bearish
Gold has been pretty bearish throughout this year, but it made a bullish move in October as the market sentiment deteriorated for a number of reasons such failure to strike a Brexit deal, upcoming US midterm elections and the Italian budget for next year. So, we saw a big climb in Gold worth around $60, although that seemed more of a retrace of the bigger downtrend.
Gold found resistance at the 100 SMA (red) on the daily chart and if you check the weekly and the monthly charts, you will see that the buyers were running against the 200 and 50 SMAs respectively. So, there was strong resistance at the top. Gold failed to break those moving averages in all these timeframe charts and it turned lower eventually.
But, the 100 SMA (green) provided solid support on the daily chart as you can see. Then, we saw another bullish move late last week as financial markets adjusted themselves before the US elections.
Once again, the resistance area resisted and Gold started slipping lower. Today, the decline picked up pace and Gold has lost more than $10 so far. Now, we are back down here at the 100 SMA (green) which is fighting for its life. The 50 SMA (yellow) has already been pierced but the 100 SMA is resisting. This area is also a support and resistance level which should add extra strength to the 100 SMA, but it remains to be seen if it will hold.
The stochastic indicator is almost oversold and when the day closes, it will surely be oversold considering the big bearish candlestick today. So, there is a chance that we might see another jump higher, which I would love since it would be a great opportunity to sell Gold. Otherwise, if the 100 SMA breaks, then I might sell the break and place the stop above the 100 SMA.


