Bitcoin Still Trading Between 2 MAs, This Time Near the Top One
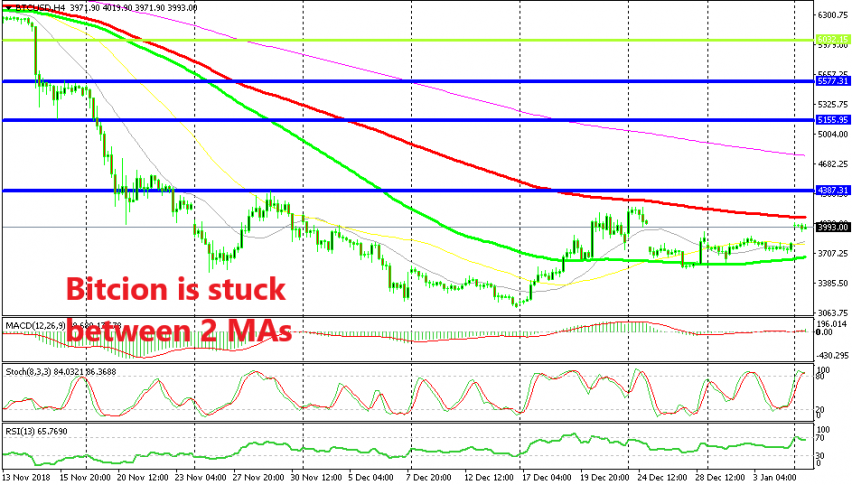
Cryptocurrencies stopped the bearish trend for a breather about a month ago after having completed the next bearish leg, posting new lows during November. They reversed higher by mid December after consolidating for about a week and in the third week of last month they retraced higher. Someone can call this as a trend reversal for now, but I don’t think it is a trend reversal. Cryptos climbed only for a week and since then they have been trading in a range, unable to make new highs.BITCOIN for example, broke above three moving averages that week, but since then it has been confined between the 100 simple MA (green) and the 100 smooth MA (red) as you can see from the H4 chart above. The 100 smooth MA has been providing resistance on the top side, while the 100 simple MA has been providing support.
You can distinguish which moving average is stronger form that chart. The price has been touching the 100 simple MA (green) during the declines a couple of times, but it has yet to meet the 100 smooth MA (red) above. The price has reversed down without reaching the 100 smooth MA, so it seems that the sellers are stronger.
We saw a bullish move during the weekend but my broker doesn’t show the weekend move, so it appears with a bullish gap. Bitcoin is still trading around the $4,000 level which is a resistance area stretching up to $4,200. The stochastic indicator is also overbought, so we are thinking of opening a sell forex signals around here, although I will wait to see if Bitcoin climbs around $100 higher to the 100 SMA which would be a better selling place, offering a better win/loss ratio.


