The Range Narrows in USD/JPY as 50 SMA Pushes it Higher
USD/JPY has been trending higher for a week but it is now forming a triangle and we might see it explode in either direction.
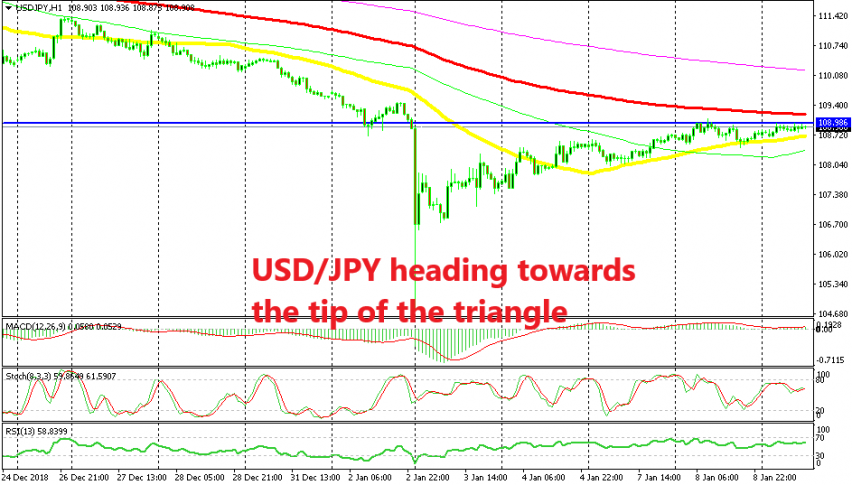
USD/JPY has been grinding higher for a week since it tumbled 5 cents lower on January 2. The uptrend has been slow but is consistent and the 50 SMA (yellow) is helping it develop with ease. USD/JPY has been finding solid support at this moving average during dips which have been pretty shallow.
Although, it has been finding it difficult to push above the 109 level which is some sort of support and resistance area. Yesterday, buyers pushed a few pips above 109 but the price returned down. The price found support at the 50 SMA once again. Once the stochastic indicator became oversold, which meant that the trend refreshed, the buyers got in again and resumed the uptrend.
I am beating myself up for losing that opportunity because it was a pretty straightforward trade. The candlesticks formed two dojis on the H1 chart which are reversing signals, so everything was pointing to a bullish reversal.
But I digress. Now we are back below the 109 level and the 100 SMA (red) is catching up with the price. This moving average comes at 109.20 and will likely provide resistance. That would squeeze USD/JPY and the triangle that is forming would close up.
In that case, expect an explosion in either direction. The upside is more favorable since the trend has been bullish for a week, but you can’t bet on it. So, let’s see what direction the break of this triangle will be in.
- Check out our free forex signals
- Follow the top economic events on FX Leaders economic calendar
- Trade better, discover more Forex Trading Strategies
- Open a FREE Trading Account
- Read our latest reviews on: Avatrade, Exness, HFM and XM
Related Articles


Sidebar rates
Related Posts
