Bitcoin has Finally Made the First Move Off the Resistance
Bitcoin has been pretty bullish this month but it failed to break above the $4,000 resistance zone and it is turning back down now.
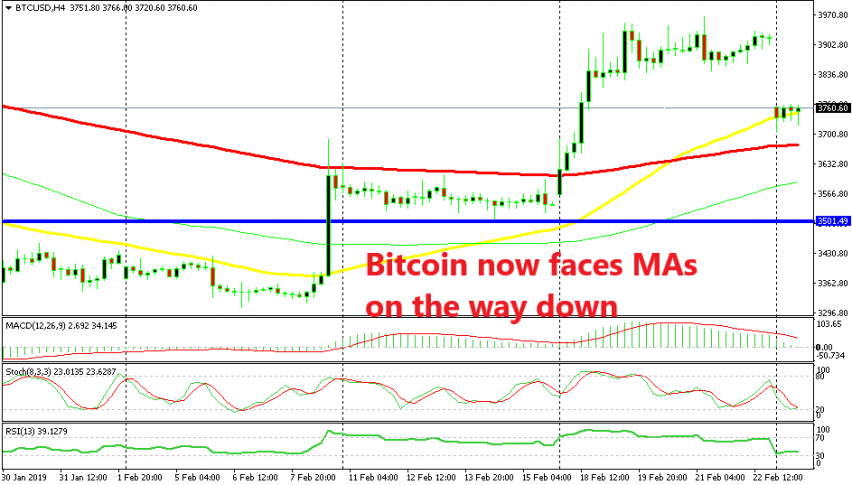
Cryptocurrencies made a bullish move this month and BITCOIN climbed around $700 during this move which unfolded in two waves. The first wave came at the beginning of February when Bitcoin jumped to $3,600s, but found resistance at the 100 SMA (red) on the H4 time-frame.
The second move came at the beginning of last week when Bitcoin climbed higher to $4,000, which is a resistance zone stretching to $4,200. But, no one had the guts to push higher above this resistance zone since the major trend in digital currencies is still heavily bearish and this is just a retrace of that downtrend.
The buyers couldn’t push above the resistance and Bitcoin traded close to below $4,000 for most of last week. That was a sign that the buyers had given up. Now, we see that Bitcoin has returned lower, declining around $250 during the weekend which appears as a gap on my chart since my broker closes shop during weekend, while the crypto market remains open.
Now, Bitcoin is facing the 50 SMA. This moving average has provided sporadic resistance to Bitcoin since late November last year, making it a bit of a hassle for the sellers to overcome. The area around $3,700 where Bitcoin is trading now used to be resistance too, so now it has turned into some form of support.
But, the 100 SMA (red) will be a tougher challenge for Bitcoin sellers to take out, I assume. We opened a long term sell signal in BITCOIN just below the 100 SMA two weeks ago when the price stopped below this moving average, so this latest bearish reversal looks great for our trade. Now we have to wait for the next move which might come in a week since that’s how cryptos move; they make a move, then they wait for several days and they make another move.
We did post the monthly chart on a Bitcoin article during the weekend which points to a long term bullish reversal, but those long term charts usually take months to materialize even when they work, so until it happens, if it does, the trend is still down. Holding on to our trade till then..
- Check out our free forex signals
- Follow the top economic events on FX Leaders economic calendar
- Trade better, discover more Forex Trading Strategies
- Open a FREE Trading Account
- Read our latest reviews on: Avatrade, Exness, HFM and XM
Related Articles


Sidebar rates
Related Posts
