GBP/USD Might Form a Big Head-And-Shoulders Pattern if the 200 SMA Holds as Resistance
GBP/USD is forming a head and shoulder pattern on the daily chart which points to massive declines if it works out
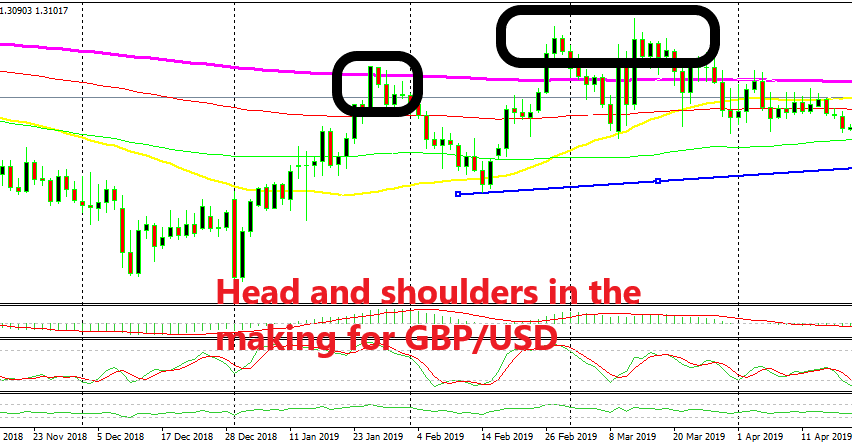
[[GBP/USD]] traded in a range during March after having been on a bullish trend during the beginning of the year. It gained nearly 10 cents during the climb and the range was around 400 pips wide at first, but it started getting narrower as the month progressed and eventually it was broken to the downside last month.
Although, the price formed a doji candlestick on the daily chart at the end of the month and last week this pair turned bullish. It surged more than 150 pips on Friday after the US data, but it reversed down yesterday, so it seems that the 200 SMA has turned into resistance.
The price broke above it for some time, but it didn’t get too far away; it stayed within its range. If you look back in January it did the same thing and then this pair retraced around 450 pips lower. It looks like it might do the same now. If this happens, then this would form a head and shoulder pattern.
If this pattern unfolds, then GBP/USD should fall to the neckline (blue line) at 1.2880 which is around 200 pips lower and then eventually break below it and continue lower until 1.2380. That’s 500 pips down from the neckline which is the same distance from the top to the neckline. There are too many things going on for the GBP right now and then add events to the USD, so technicals are a bit out of place now for this pair, but that’s a scenario to keep in mind for those who trade large term charts.
- Check out our free forex signals
- Follow the top economic events on FX Leaders economic calendar
- Trade better, discover more Forex Trading Strategies
- Open a FREE Trading Account
- Read our latest reviews on: Avatrade, Exness, HFM and XM
Related Articles


Sidebar rates
Related Posts
