EUR/GBP Reverses at the 100 SMA, But Faces the 50 SMA Now
EUR/GBP retraced higher yesterday, but the retrace ended at the 100 SMA on H4 chart
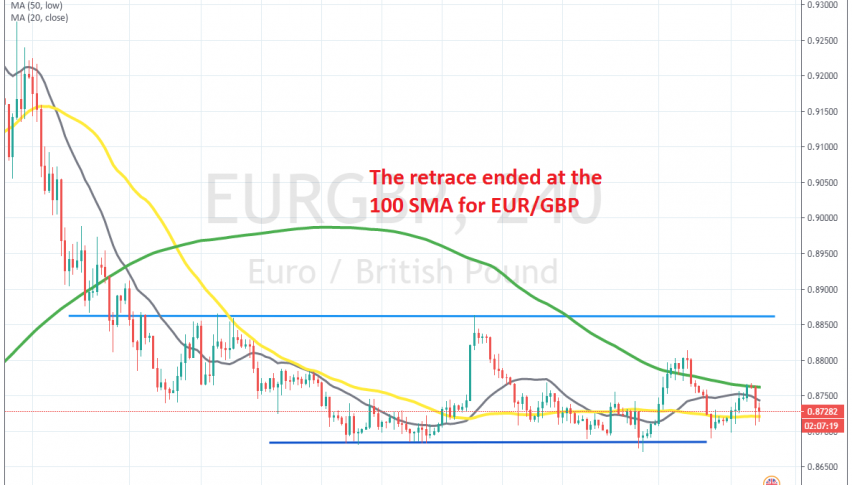
EUR/GBP turned quite bearish by the middle of March, after climbing more than 12 cents since last February. But, the price turned bearish at 0.95 as the GBP surged back up, with GBP/USD climbing around 11 cents in a couple of weeks, which sent this pair on a strong down move.
The price fell to 0.8660-70 but stopped there and EUR/GBP formed a support area around this level. We have seen the price retrace higher a few times since mid April but buyers haven’t been able to reverse EUR/GBP to bullish. So, EUR/GBP has been trading inside a range since then.
Yesterday, we saw another retrace higher after the price bounced off the support zone once again and we decided to go short on EUR/GBP. The retrace continued higher to the 100 SMA (green) but it seems like that moving average turned into resistance. EUR/GBP reversed back down from the 100 SMA. Although, now the 50 SMA (yellow) is acting as support. We need the sellers to push below this moving average so the price can reach the take profit target of our signal.
- Check out our free forex signals
- Follow the top economic events on FX Leaders economic calendar
- Trade better, discover more Forex Trading Strategies
- Open a FREE Trading Account
- Read our latest reviews on: Avatrade, Exness, HFM and XM
Related Articles


Sidebar rates
Related Posts
