Tempted to Sell EUR/USD After the Head and Shoulders
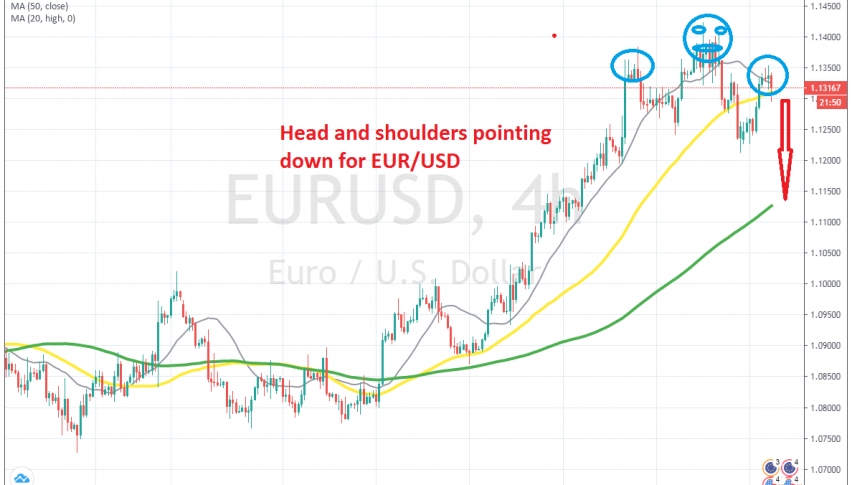
EUR/USD retraced higher yesterday, forming a head and shoulders pattern which points down
Yesterday I posted an article on EUR/USD , explaining how the bullish retrace was coming to an end on the weekly chart. The 100 SMA was also providing resistance on this time-frame chart, which had reversed another strong bullish retrace in March, so this is a similar chart pattern.
This pair climbed to that moving average last week but failed to break it and retraced lower. Besides that, EUR/USD formed a bearish reversing candlestick last week. The price fell more than 200 pips late last week, but it retraced higher again yesterday.
But it seems like the climb is over again and now a head and shoulders pattern has formed, pointing to the downside. The height of the shoulders is not exactly the same and the neckline is not horizontal either, but they don’t have to be for this pattern. So, after the bearish chart pattern in the weekly chart and the head and shoulders here is also pointing down for this pair. I was waiting for a retrace higher yesterday and it happened, so I might open a long term sell signal here, targeting 1.10, with a stop above 1.15.
- Check out our free forex signals
- Follow the top economic events on FX Leaders economic calendar
- Trade better, discover more Forex Trading Strategies
- Open a FREE Trading Account
- Read our latest reviews on: Avatrade, Exness, HFM and XM
Related Articles


Sidebar rates
Related Posts
