If the 100 SMA Holds, the Bullish Reversal Is On in USD/CAD
USD/CAD is finding support at the 10-0 SMA again today
The CAD is closely correlated to the Canadian Dollar, so USD/CAD has been following Oil prices up and down, on the opposite direction, since the CAD is the second currency of this pair. Crude Oil was climbing since April until the beginning of September, hence the strong bearish trend in USD/CAD .
USD/CAD fell below 1.30 for a brief moment, but the bullish trend ended in crude Oil, so the decline in USD/CAD also ended. This forex pair climbed more than 400 pips higher, getting above 1.34. Moving averages provided some resistance again as the price was climbing higher, but they eventually turned into support after being broken.
The 100 SMA (grey) held the price during the pullback by the middle of September. That moving average provided support again on Monday, after USD/CAD retreated lower from above 1.34, where it had formed a resistance zone, which eventually reversed the price down.
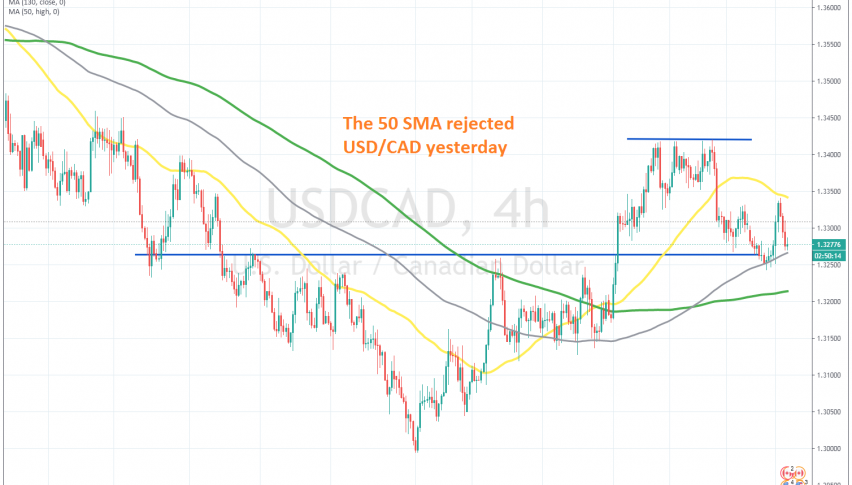
USD/CAD bounced off the 100 SMA yesterday, but the 50 SMA (yellow) turned into resistance on the H4 chart, rejecting the price and reversing this pair down. Now, sellers are trying the 100 SMA again if it will hold as support. If it does, then the bullish trend is official in this pair. We might go long on this pair if that’s the case.
- Check out our free forex signals
- Follow the top economic events on FX Leaders economic calendar
- Trade better, discover more Forex Trading Strategies
- Open a FREE Trading Account
- Read our latest reviews on: Avatrade, Exness, HFM and XM
Related Articles


Sidebar rates
Related Posts
