Getting Ready to Buy Bitcoin Cash, With the Retrace Down Almost Complete
Moving averages have turned into support for Bitcoin Cash, where we plan on buying
Bitcoin Cash Daily Chart Analysis
Buyers have returned again in Bitcoin Cash this year, after it was trading sideways until the end of 2020, while other cryptocurrencies were surging at the end of last year. Bitcoin Cash (BCH) had a nice run in 2007-08 when the crypto market was booming, but it crashed lower back then and traded around $250 for a long time.
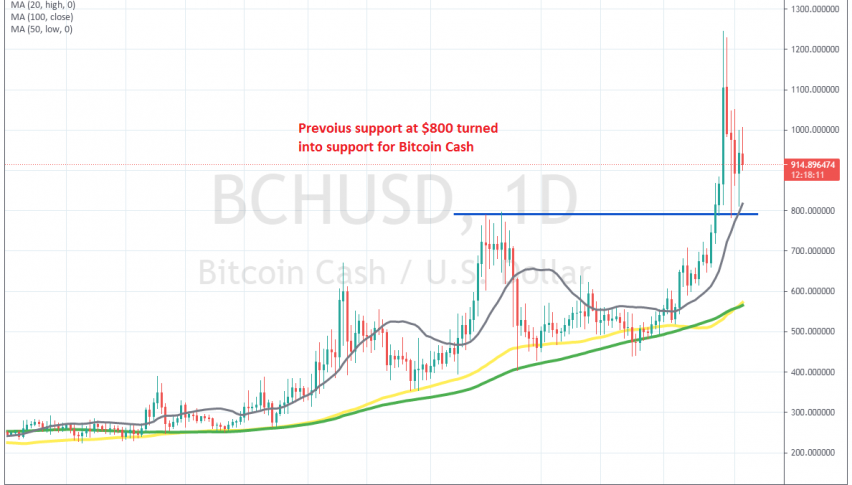
But, BCH/USD caught up with the crypto curge and the bullish trend resumed in January this year, as we covered in our BCH price forecast for 2021. In February we saw a strong bullish move, which took the price to $800. But it reversed back down, following other digital currencies.
But, moving averages such as the 50 SMA (yellow) and the 100 SMA (green) held well as support indicators on the daily chart, pushing the lows higher. This month the bullish trend resumed again, as major cryptocurrencies pushed to new record highs. Although Bitcoin Cash is a long way from the all time highs back in 2007 above $4,000 according to my broker.
BCH/USD climbed to $1.250 on my chart until last Saturday, when we saw a sudden bearish reversal in the crypto market and a crash down just below $800 for this altcoin. But, the previous high held as support now, aided by the 20 daily SMA (gray) as well.
Bitcoin Cash H4 Chart Analysis
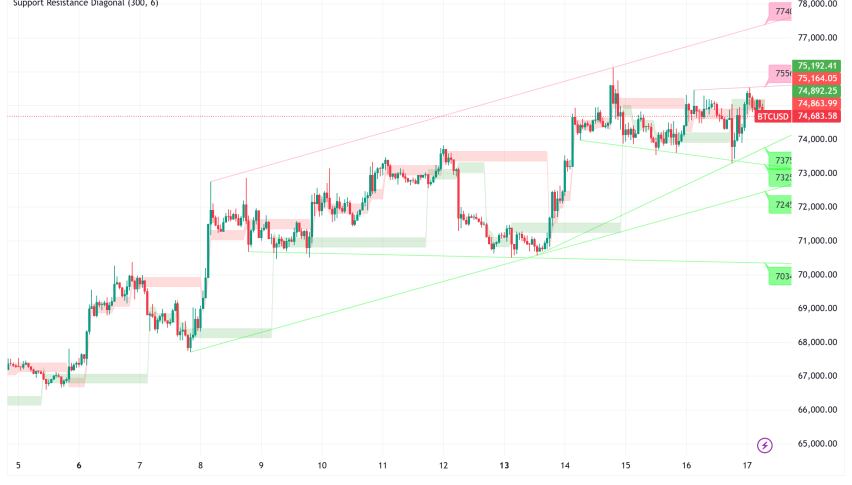
Yesterday we saw a$200 bounce off this moving average, but today the price is turning down again. Now, this looks like a good opportunity to go long on Bitcoin Cash. The H4 chart also looks set for a bullish reversal soon.

Getting ready to buy BCH/USD at the 50 SMA
We see that the 50 SMA (yellow) has turned into support on this time-frame, having provided support twice in the last few days. The highs are getting higher as well, but the 20 SMA is acting as resistance now.
The price is returning back down to the 50 SMA now and we are considering going long at the 50 SMA if it hold again. If we get a bullish reversing signal such as a doji or pin/hammer candlestick, then we will open a buy forex signal here, so make sure to follow our forex signals section to get the right timing for this trade.
- Check out our free forex signals
- Follow the top economic events on FX Leaders economic calendar
- Trade better, discover more Forex Trading Strategies
- Open a FREE Trading Account
- Read our latest reviews on: Avatrade, Exness, HFM and XM
Related Articles

Sidebar rates
Related Posts
