Ethereum Price Forecast – ETH Violates Double Top Resistance, Brace for Buying
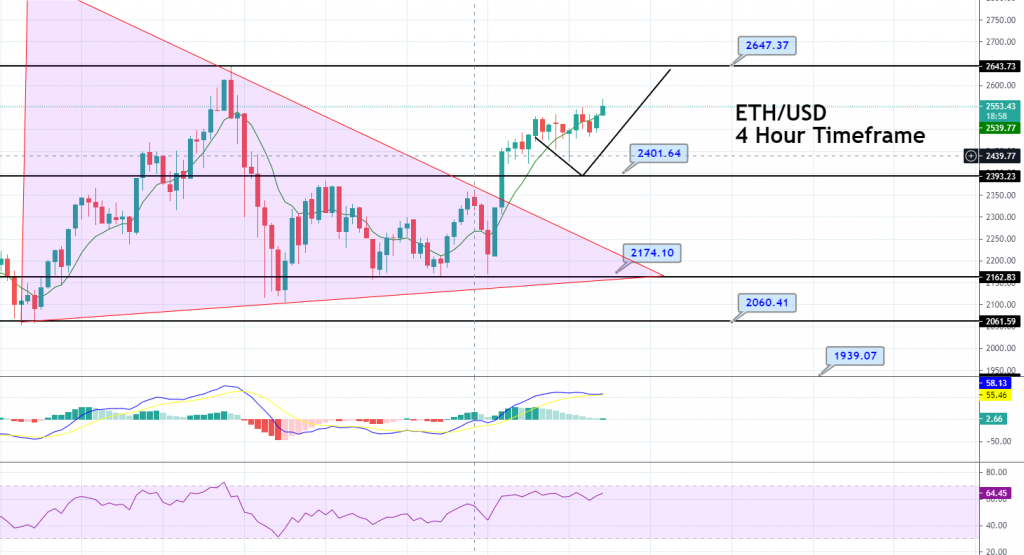
ETH/USD closed at $2533.18 after placing a high of $2533.18 and a low of $2319.16. ETH rose on Monday and reached near its all-time high
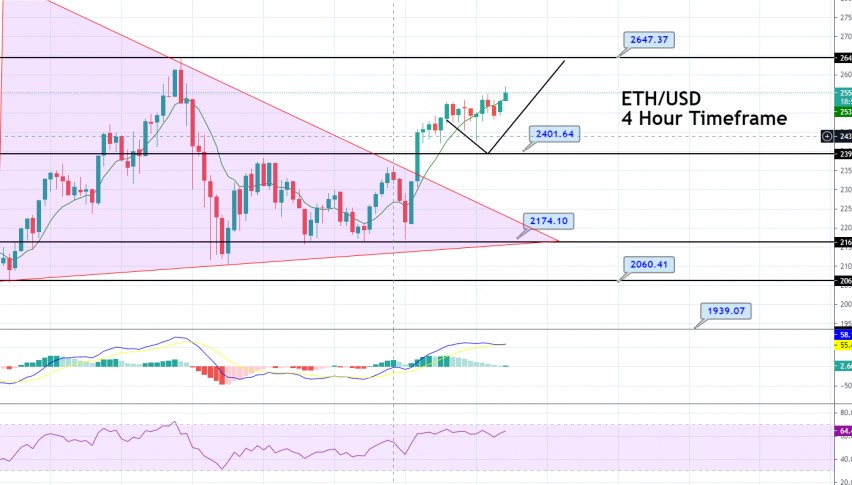
ETH/USD closed at $2533.18 after placing a high of $2533.18 and a low of $2319.16. ETH rose on Monday and reached near its all-time high following the recent surge in BITCOIN prices along with much positive news on the Ethereum front. The cryptocurrency market leader, Bitcoin, rose on Monday and recovered most of its previous four days’ losses that marked an impressive recovery. This recovery in Bitcoin prices added support to the whole crypto market and pushed altcoins, including ETH/USD.
On the other hand, the chief strategy officer of CoinShares, Meltem Demirors, revealed that many funds were moving from Bitcoin into Ethereum. She added that data from CoinShares suggested that the demand for Ethereum via several exchange-traded products was on the rise compared to Bitcoin. These comments added strength in ETH/USD and pushed its prices near an all-time high (ATH) level on Monday.

ETH/USD Daily Technical Levels
- Check out our free forex signals
- Follow the top economic events on FX Leaders economic calendar
- Trade better, discover more Forex Trading Strategies
- Open a FREE Trading Account
- Read our latest reviews on: Avatrade, Exness, HFM and XM
Related Articles


Sidebar rates
Related Posts
