Shiba Inu Breaks Above the Descending Trendline. But where is the Volume?
It has been a good week for the crypto bulls, who have been betting on a return to the up-trending markets witnessed in April. Almost all cryptocurrencies gained over the week, albeit some at a slower rate. But now, the markets are facing another twist: where are the buyers?
Shiba Inu, a decentralized meme token that earned a name through influencer mentions, has shown strength this week. On Friday, July 23, SHIB/USD was trading more than 1% higher. The token was nevertheless showing a lot of indecision to the upside around a previous minor resistance/support area of 0.00000656.
Remember!
The previous outlook for Shiba Inu pointed to further downsides, to a low of about 0.00000565. As per this projection, prices proceeded to hit a low of 0.00000570 before bouncing back.
SHIB/USD – A Technical Outlook
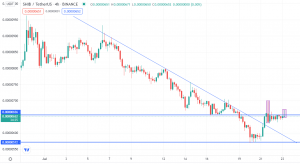
Shiba Inu 4HR Chart Analysis
A technical look at SHIB/USD on a 4-hour chart shows that the token bounced off from major support around 0.00000570. This was after forming multiple bullish pin bars, with the jump breaking above the descending trendline.
Shiba Inu is now contained within the previous support, which is now acting as resistance around 0.00000656. At the time of writing, a bearish pin bar was forming around the resistance after another major bearish pin bar failed to take prices lower.
SHIB/USD Trade Idea
I expect the current bullish momentum of crypto tokens and Shiba Inu to continue in the medium to long term. However, it should be noted that much of the market rhetoric about regulation has not changed, and the bulls are still cautious.
I view the current indecision of SHIB/USD around 0.00000656 as an attempt to take the crypto token lower. The prediction is based on the formation of bearish pin bars around the resistance and loss of bullish momentum/volume at the level.
A break of SHIB/USD below the 0.00000656 could see it test the support at 0.00000570. I expect prices to continue being supported at this level as bulls weigh whether to jump into the market.
For now, I recommend that traders take shorts from the current resistance level and pin bar price signal confirmation, targeting the lower support at 0.00000570.
Nonetheless, my general view of SHIB/USD is bullish, given the break above the trendline. Buy trades should only be taken after prices retest the 0.00000570 support, followed by the formation of bullish signals. For now, keep up-to-date on SHIB/USD, to determine when you can reliably take a buy on the crypto token.
- Check out our free forex signals
- Follow the top economic events on FX Leaders economic calendar
- Trade better, discover more Forex Trading Strategies
- Open a FREE Trading Account
- Read our latest reviews on: Avatrade, Exness, HFM and XM
Related Articles
Sidebar rates
Related Posts
