Wait for the Retreat to End at the 20 SMA in Ripple XRP Before Buying Again?
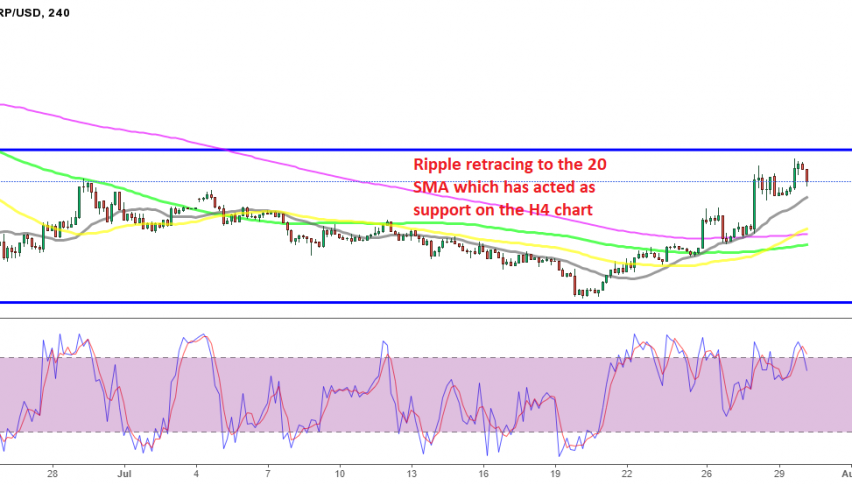
Ripple coin heading for the 20 SMA on the H4 chart, which has acted as support this week
Cryptocurrencies have been bullish over the last 10 days, since early last week, with Bitcoin bouncing from below $30,000 to $41,000. For BITCOIN, that means a gain of more than a third of its value in a short time, while some other cryptocurrencies have been making even bigger gains during this time.
The Axie Infinity token (AXS) has almost quadrupled in value, surging from around $14 to $52, thanks to this bullish momentum in cryptos. Ripple coin XRP which was really bearish over the past two months, hasn’t been performing very well during this time, but it has made some decent gains nonetheless and the progress in the legal case with the US securities authority, SEC, seems to have helped.
As my colleague Rowan highlighted earlier, during the Asian session, Attorney Jeremy Hogan, who has followed the SEC’s lawsuit against Ripple closely, believes there is a good chance that the settlement could come sooner rather than later. Besides that, there has been speculation that Coinbase is about to relist XRP, and also that it is going live in some form.
This has helped XRP/USD to surge from above $0.50 to around $0.76, which was an increase in value of around 50% from the bottom. During this time, the 20 SMA (gray) was doing a great job of providing support for the XRP/USD on the H4 chart. This moving average provided resistance when the price was declining, and now it seems to have turned into support.
Ripple Live Chart
But the price is reversing down from near the top of the range, with the area around $0.77-0.78 and all the way to $0.80 acting as support and resistance before, and it seems like it has scared buyers away for the time being, since RIPPLE coin is retreating down. However, this is due to the retreat in the broader crypto market, which saw Bitcoin falling to $38,300s.
There hasn’t been any reason for the decline in cryptos, so this looks like another pullback down before the bullish trend resumes again. We are waiting for the pullback to reach the 20 SMA on this chart at $0.60, and we will consider going long from there again, targeting the top of the range at $0.80. That looks like a decent trade to take, probably with a stop below the 200 SMA (purple), just below $0.60.
- Check out our free forex signals
- Follow the top economic events on FX Leaders economic calendar
- Trade better, discover more Forex Trading Strategies
- Open a FREE Trading Account
- Read our latest reviews on: Avatrade, Exness, HFM and XM
Related Articles


Sidebar rates
Related Posts
