Thorchain (RUNE) and Basic Attention Token (BAT) – A Strong Bullish Performance Last Week
Last week was neutral for most cryptocurrencies, as the crypto market was trying to stabilize after the retreat of the previous week, which sent Bitcoin from the new record highs of $67,000 to below $60,000. Even the cryptos that were quite bullish earlier in October traded sideways last week, although some cryptos that weren’t showing any particular bullish momentum before, such as Thorchain and Basic Attention Token, turned bullish last week.
Thorchain Price Analysis – Rune Heading for New Highs
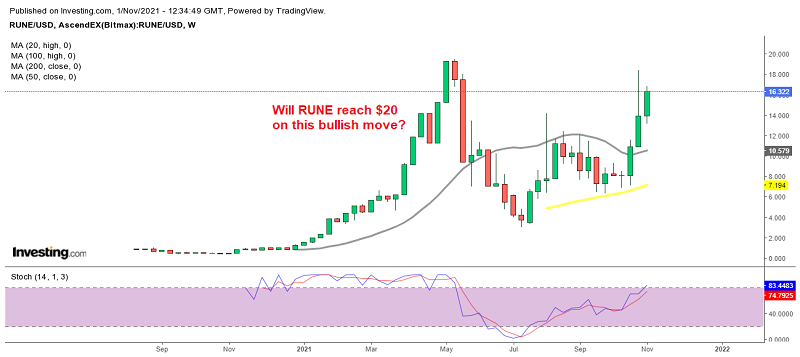
After the crash that took Thorchain from almost $20 all the way down to $3 in summer, RUNE/USD had a decent go at the upside in August. Buyers pushed the price above the 20 SMA (gray) on the weekly chart but it retreated again, and this moving average turned into a solid resistance indicator.
Thorchain Coin RUNE Live Chart
Rune retreated further, but the 50 SMA (yellow) turned into support for this cryptocurrency and it held its price for a few weeks. In the second week of October, the price formed a doji candlestick above that moving average, which is a bullish reversing signal. The price turned bullish after that, and Thorchain put on a great performance in the last two weeks, and this week is already looking bullish, even though there have been only two trading sessions so far. The price increased from around $7 to $18, and it is now trading at around $16.
Thorchain suffered a few hacks earlier this year, losing $8 million in RUNE coins, although this didn’t have much impact on the price. Now, the reactivation of the Ethereum pool, as well as other altcoin and BTC-based pools, are having a positive impact on the RUNE price. The sentiment is also turning bullish this week, judging from the price action today, so RUNE/USD is expected to rally further, and perhaps make new all-time highs above $20.
BAT Price Analysis – BAT Bouncing Off MAs

The 50 SMA pushed BAT higher for several months
Basic Attention Token was trading in a very tight range during most of October, until the last week. As can be seen in the weekly chart above, BAT coin has found support at the 50 SMA (yellow) on the weekly chart since the dive in May. That moving average has been acting as a support indicator, pushing the lows higher, despite being pierced.
The 20 SMA (gray) was acting as resistance at the top though, pushing the highs lower and narrowing the trading range for BAT. Last week, we saw a jump after the small pin above the 50 SMA, which is a bullish signal. The price jumped from around $0.64 to $1.46, but retreated on the last day of the month, giving back about half the gains.
Basic Attention Coin Monthly Chart

The 20 SMA held as support for BAT on the monthly chart
On the monthly chart, we see that after the reversal from the highs of $1.60 in April, the price fell to $0.45, where it met the 20 monthly SMA (gray). This moving average has been acting as support since then, despite being pierced a couple of times. Last month, the price bounced off the 20 SMA, which came in the last few days, but after the retreat in the very last days of October, the monthly candlestick closed near the middle. This month has already started quite bullishly, so perhaps we will also see new highs for Basic Attention Coin soon.


