Bitcoin Price Prediction – Can $41K Push BTC/USD Higher?
Bitcoin has risen above the $42,000 mark against the US dollar, showing signs of life, and may continue to rise above $42,200. BTC has..
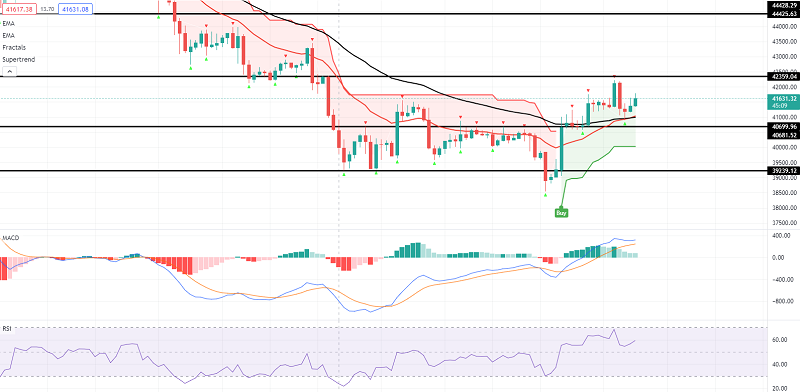
Bitcoin has risen above the $42,000 mark against the US dollar, showing signs of life, and may continue to rise above $42,200. Bitcoin has remained well supported above $41,000 and $41,100. The price is now trading above $41,500 and the 100 hourly simple moving average.
On the hourly chart of the BTC/USD pair, a key bullish trend line is forming with support near $41,050. If the pair settles above the $42,000 resistance level, a strong upward move could begin.
Bitcoin’s Price Continues to Rise
Bitcoin’s price continued to rise above the $41,500 resistance level. BTC/USD has even surpassed the $42,000 resistance level and is trading above the 100-hourly simple moving average.
Before the price began to fall, a high was formed near $42,235. There was a drop below the pivot level of $41,500. The price even fell below the $41,000 mark, but found support near the $40,900 mark.
A new base has been established, and the price is now back above $41,500. Bitcoin climbed above the 50% Fib retracement level of the recent decline from the $42,235 swing high to the $40,900 low. It is currently trading above $41,500 and the 100 hourly simple moving average. A key bullish trend line is also forming, with support near the $41,725USD pair. On the upside, immediate resistance is near the $41,725 level.
The Fib retracement level of the recent decline from the $42,235 swing high to the $40,900 low is also near the $41,725 level. The next significant resistance level could be $42,000. To begin a strong upward move, the price must first settle above $42,000 and then clear $42,230. If the bulls are successful, the price could rise to the $43,200 resistance level.
Dips Accepted in BTC?
If Bitcoin fails to break through the $42,000 resistance level, it may begin a downward trend. On the downside, there is immediate support near the $41,250 level.
The next major supports are the trend line zone and the $41,000 level. If the price falls below the trend line, it could reach $40,750, or the 100 hourly simple moving average.
- Check out our free forex signals
- Follow the top economic events on FX Leaders economic calendar
- Trade better, discover more Forex Trading Strategies
- Open a FREE Trading Account
- Read our latest reviews on: Avatrade, Exness, HFM and XM
Related Articles


Sidebar rates
Related Posts
