Is Gold Resuming the Downtrend After Failing at the 100 Daily SMA?
Gold has been retracing higher for the last two weeks, but it seems like good times might have come to an end after the failure late last we
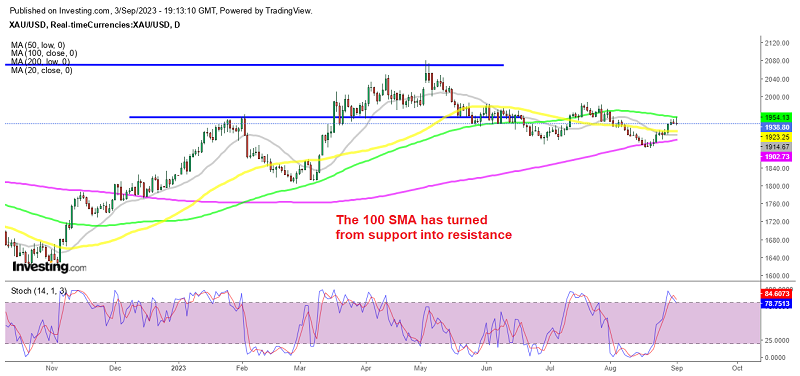
Gold had been sliding lower since May, following a retracement higher in early summer that ultimately resulted in a lower high. This downward trend continued until the middle of August, characterized by a series of lower highs. Sellers pushed the price below the 200 daily SMA (purple) which stood at around $1,900. However, we saw a reversal by the middle of last month, which sent the price to the 50 SMA (yellow) first on the daily chart. This moving average provided some resistance, but it was eventually broken as the USD turned weaker.
Federal Reserve Chair Jerome Powell’s comments on economic data and the potential for further interest rate hikes also played a role in market dynamics. But last week, the economic data from the United States was relatively soft, which has put downward pressure on the U.S. dollar (USD). When the USD weakens, it often leads to an increase in demand for other assets, including GOLD which benefited from that.
This change in sentiment served as a catalyst for Gold buyers to continue pushing higher until it reached the 100 SMA (green). This moving average has been acting as support twice earlier this year, once in March and once in May, but seems to have turned into resistance now and it stopped buyers for several days, who now seem exhausted. The price has formed three doji candlesticks which are bearish reversing signals and the stochastic indicator is overbought in this timeframe.
So, this looks like a bearish reversing chart setup, pointing down this week. After all, the larger trend since March is still bearish. It is true that markets are mainly trading the USD and the events released on Friday built a case for USD buyers. The US Nonfarm Payrolls numbers for August weighed on the positive side. The headline figure for Nonfarm Payrolls (NFPs) increased to 187K, beating expectations of 170K and exceeding the previous month’s 157K.
Additionally, when it comes to economic activity, the Institute for Supply Management (ISM) Manufacturing Purchasing Managers’ Index (PMI) data for the United States in August exceeded consensus expectations. The actual PMI figure came in at 47.6 points, which was higher than the anticipated 47.0 points and marked an improvement from the previous month’s 46.4 points. So, after the retreat in the USD last week due to softer economic figures, perhaps it’s time this week for an advance, which would mean a decline for Gold.
Gold Live Chart
- Check out our free forex signals
- Follow the top economic events on FX Leaders economic calendar
- Trade better, discover more Forex Trading Strategies
- Open a FREE Trading Account
- Read our latest reviews on: Avatrade, Exness, HFM and XM
Related Articles


Sidebar rates
Related Posts
