Strong Bearish Reversal in USD/CAD Despite Soft Employment Figures from Canada
Strong Bearish Reversal in USD/CAD Despite Soft Employment Figures from Canada
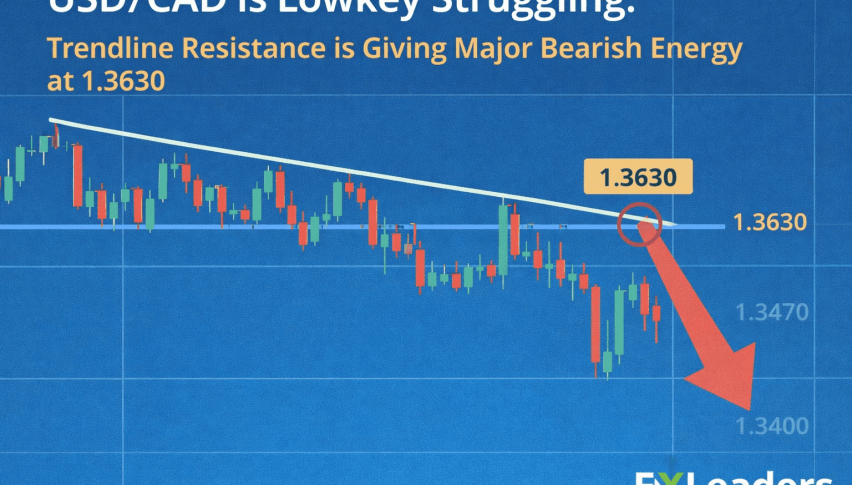
By the middle of last week USD/CAD peaked above the swing region to trade near the topside resistance zone on the daily chart, just touching 1.39. Before stalling, the maximum price hit 1.3903, as crude Oil kept declining, while the employment report from Canada for October was weak. But buyers couldn’t hold the price up there an it reversed back down, heading for the 50 SMA (yellow) which stands at about 1.3630.
The mood change took place when traders and experts concluded that the Fed had completed its rate hikes and that the next move would be a rate decrease as soon as July 2024. This viewpoint roiled financial markets throughout the world. Global market indices rose, as the 10-year US Treasury rate fell from 4.95% on October 31 to 4.63% yesterday.
The US dollar retreated today, with the US dollar index (DXY) falling from 106.88 before the FOMC to 105.89. However, the market has had a very poor track record in forecasting Fed movements this year.
USD/CAD Daily Chart – Buyer Failed at the Resistance

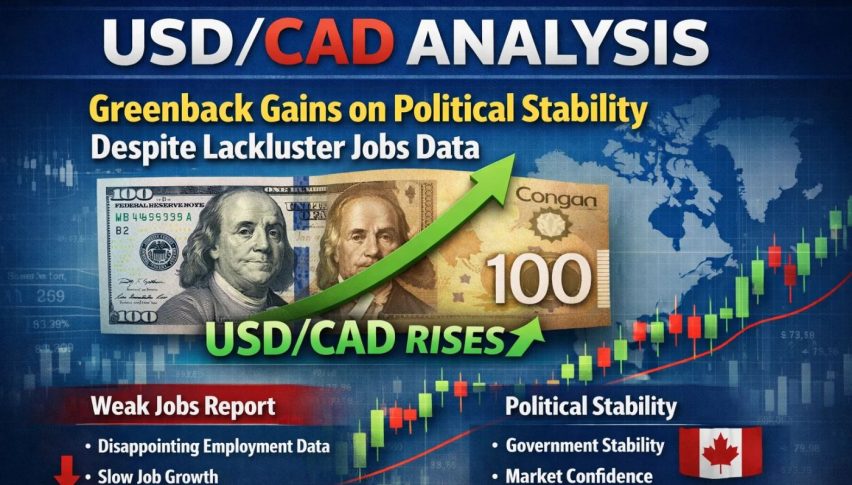
Canadian October 2023 Jobs Report
- October employment change +17.5K vs +22.5K expected
- September employment change was +63.8K
- Unemployment rate 5.7% vs. 5.6% expected. Last month 5.5%.
- Full-time employment -3.3K vs +15.8K last month
- part-time employment +20.8K vs. +47.9k last month.
- Participation rate 65.6% vs 65.5% last month.
- Average hourly wages permanent employees 5.0% vs 5.3% y/ last month
USD/CAD Live Chart
USD/CAD tried to break above the resistance zone around 1.39 last week as the data showed a showing economy in Canada while Oil was slipping lower. But the reversal in the USD saved the CAD and this pair closed the week around 250 pips lower from the high
- Check out our free forex signals
- Follow the top economic events on FX Leaders economic calendar
- Trade better, discover more Forex Trading Strategies
- Open a FREE Trading Account
- Read our latest reviews on: Avatrade, Exness, HFM and XM
Related Articles

Sidebar rates
Related Posts
