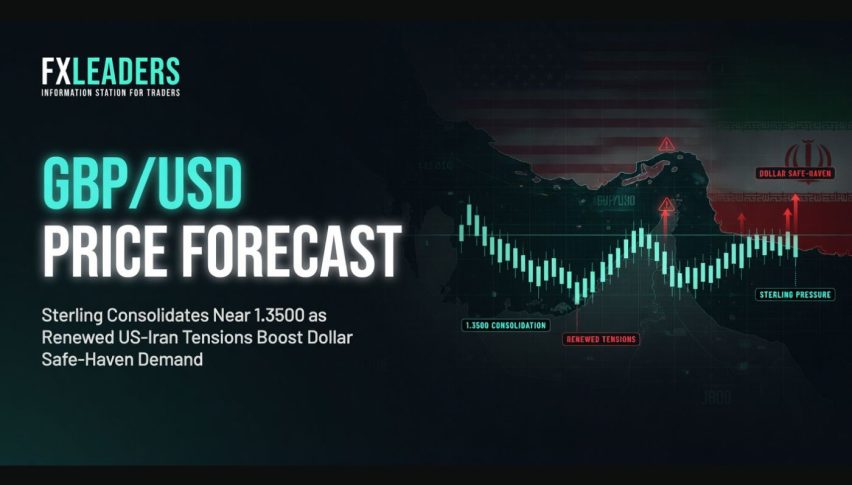
GBP/USD Remains Supported by MAs After the GDP Report
GBP/USD plummeted more than 10 cents in Q3 of last year, but in the last months of 2023, this pair saw high demand again as the USD tumbled
GBP/USD plummeted more than 10 cents in Q3 of last year, but in the last months of 2023, this pair saw high demand again as the USD tumbled lower on dovish FED rhetoric. Despite the UK economy’s deterioration, we saw a reversal in November, and the price has been steadily rising since then, with the year ending near 1.30 and moving averages acting as support on different timeframe charts.
The GBP doesn’t have much going on for itself, with the UK economy hoovering around recession/stagnation but, the USD continues to display weakness, keeping this pair upbeat, as it continues to rise despite a stronger consumer inflation report from the US yesterday. That’s because the market is adjusting for rate cuts to start this year around the globe, which has been pulling the USD down, as traders expect the FED to start cutting interest rates first, probably by March.
Yesterday GBP/USD Dipped around 60 pips lower just below 1.27, where it found support at the 100 SMA on the H4 chart and it rebounded back up where it was later, sio we are keeping a bullish bias for this pair and will buy retracs lower. This morning we had the inflation report from the UK, which showed a return to growth in November after a-0.3% contraction in October, which is positive.
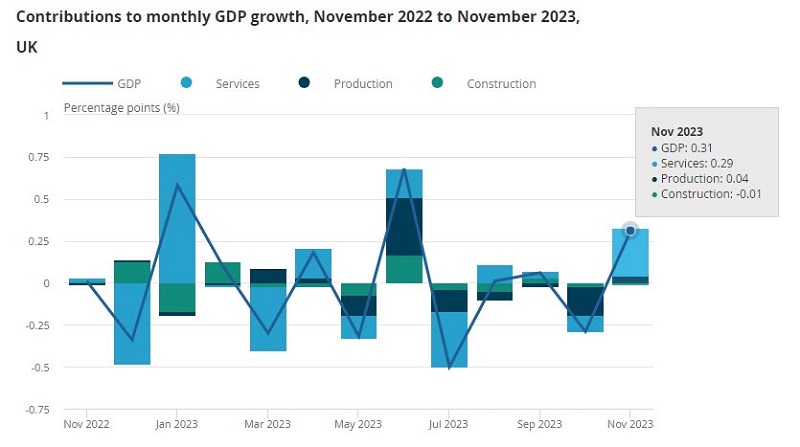
UK November GDP Report
- November monthly GDP +0.3% vs +0.2% m/m expected
- October GDP was -0.3%
- Services output +0.4% m/m
- Industrial output +0.3% m/m
- Manufacturing output +0.4% m/m
- Construction output -0.2% m/m
This just reaffirms a modest recovery in the UK economy towards the end of last year, as evident by the PMI data in the last two months as well. That does offer the BOE some added breathing room on holding rates, although the consumer side remains weak and that is something to be wary about for the months ahead.
GBP/USD Live Chart
- Check out our free forex signals
- Follow the top economic events on FX Leaders economic calendar
- Trade better, discover more Forex Trading Strategies
- Open a FREE Trading Account
- Read our latest reviews on: Avatrade, Exness, HFM and XM
Related Articles


Sidebar rates
Related Posts
