Copper at $3.88: China Stimulus Rally Fades, Fed Eyed
Copper prices are experiencing a slight pullback after a robust rally fueled by China's stimulus announcements.
Copper prices are experiencing a slight pullback after a robust rally fueled by China’s stimulus announcements. In the Asian trading session, the metal fluctuated around the $3.88 mark on the 4-hour chart, indicating market indecision.
Technical analysis suggests copper is in the overbought zone, hinting at a possible bearish correction. The anticipation of an economic revival in China, the top copper consumer, sparked a rebound from recent lows.
Nonetheless, copper’s start to 2024 was subdued due to tepid economic data from China in December, which stoked concerns over slowing demand—a significant factor affecting copper prices in the past two years.
Investor focus is now shifting to upcoming U.S. economic reports, including the fourth-quarter GDP and PCE price index, to glean insights into future Federal Reserve rate adjustments. With the Fed’s initial 2024 meeting approaching and expectations set for maintaining current rates, any indications of rate reductions will be scrutinized.
Although traditionally gold could benefit from lower interest rates, the near-term outlook remains tempered, particularly if the Fed sustains higher rates. Elevated interest rates reduce the attractiveness of gold investments by increasing the opportunity cost.
Despite this, gold achieved a 10% gain in 2023, partly driven by safe-haven demand amid heightened Middle East tensions.
Copper Technical Outlook
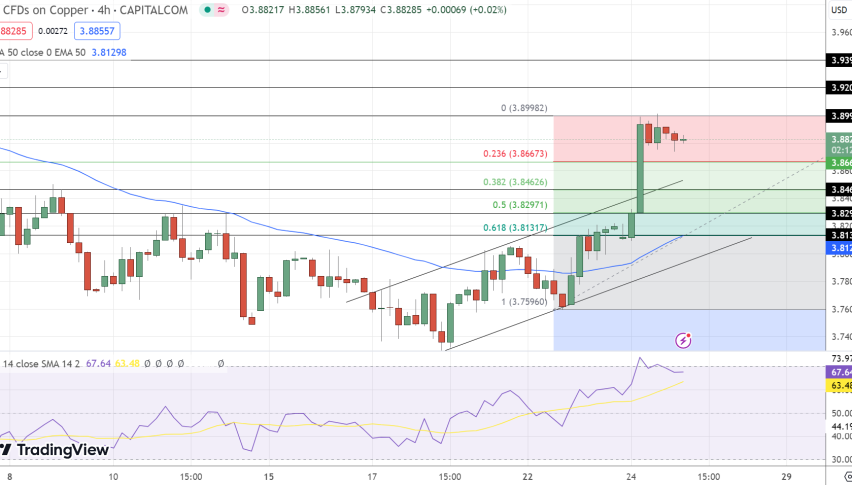
Copper’s trajectory on the charts is showing signs of a potential downturn as the commodity struggles to maintain its position above the critical resistance level at $3.8995. A series of bearish candles have emerged, indicating a loss of bullish strength.
Notably, the Relative Strength Index (RSI) is hovering just below the overbought threshold of 70, further suggesting that the current upward trend may be losing steam. The pivot point, represented by the green line, sits at a juncture that could dictate the near-term direction of copper prices.
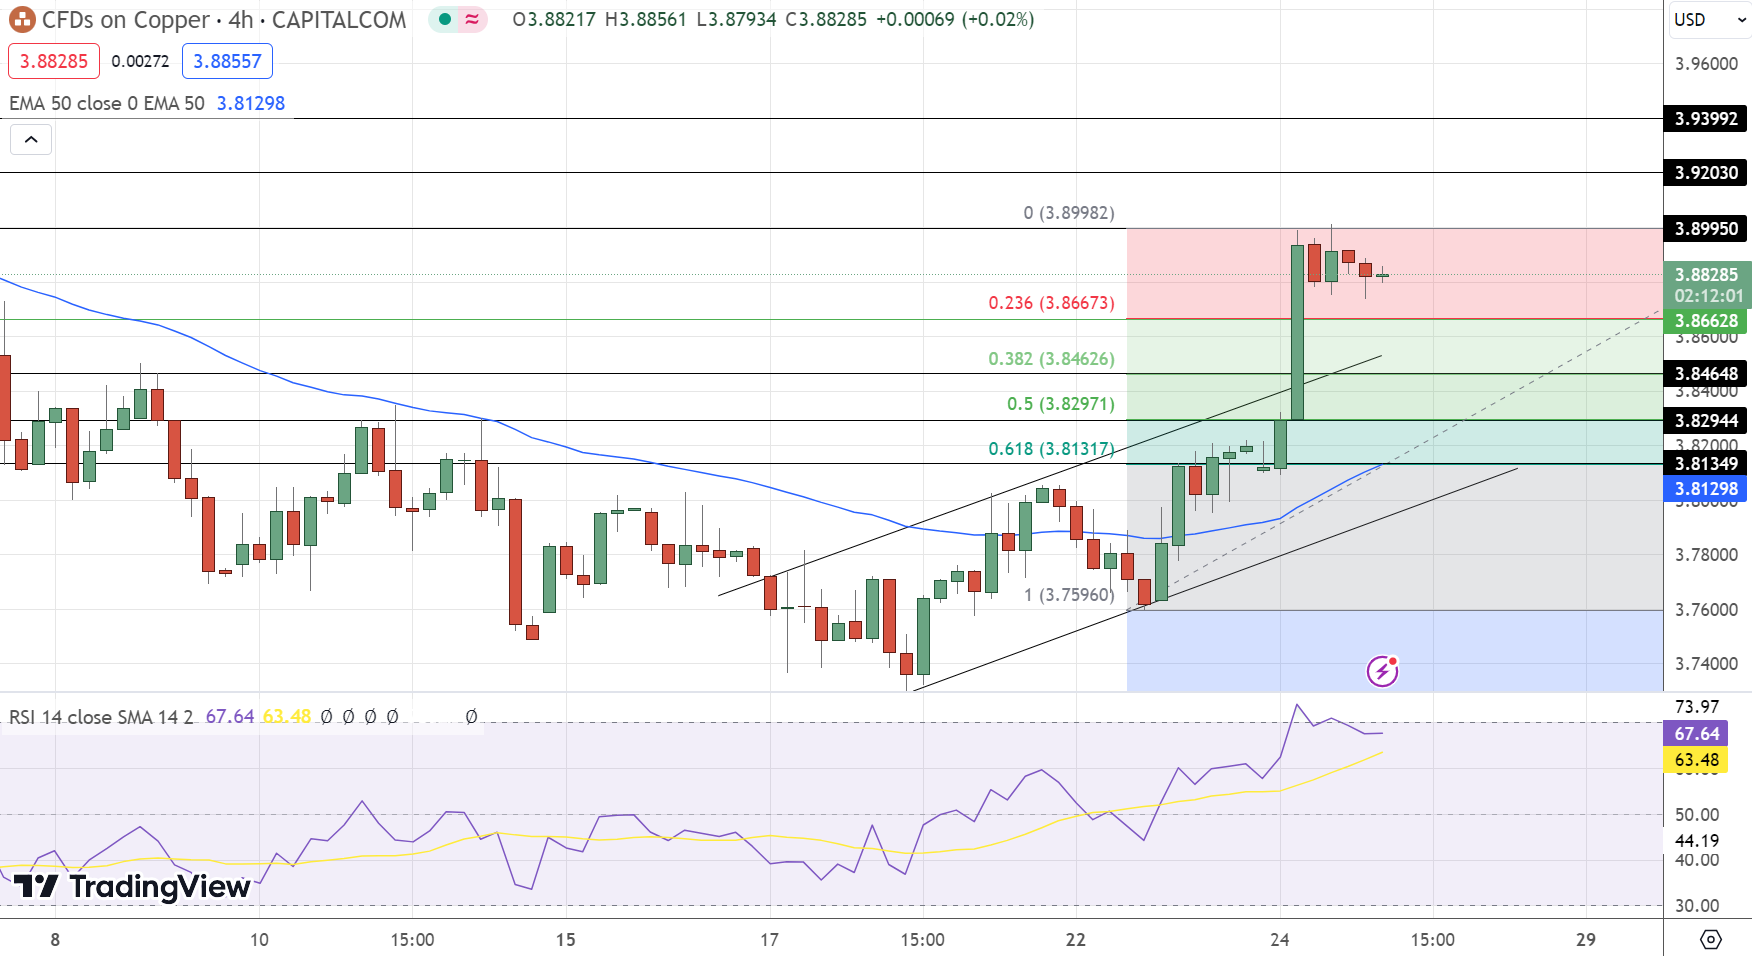
Resistance levels are established above this line, with the first resistance at $3.9203, followed by higher barriers at $3.8950 and the peak at $3.8995, each capable of curtailing upward movements. Conversely, support levels below the pivot point stand ready to catch a bearish retracement.
The first support level is at $3.86, aligning with the 23.6% Fibonacci retracement, followed by more substantial support at $3.84, correlating with the 38.2% retracement level. A further potential cushion exists at $3.8198, near the 50 EMA.
The combination of copper’s inability to break and hold above these resistance levels, coupled with the RSI nearing overbought conditions, points to a possible retreat towards these support levels.
- Check out our free forex signals
- Follow the top economic events on FX Leaders economic calendar
- Trade better, discover more Forex Trading Strategies
- Open a FREE Trading Account
- Read our latest reviews on: Avatrade, Exness, HFM and XM
Related Articles


Sidebar rates
Related Posts
