Copper Price at $3.88: Bearish Trend Amid China’s Market Exodus
Copper prices are exhibiting a downtrend, currently trading at $3.8797, marking a decline of 0.60%.

Copper price is exhibiting a downtrend, currently trading at $3.8797, marking a decline of 0.60%. The commodity, often seen as a barometer for economic health, reflects broader market trepidations.
Investment Shifts as Chinese Markets Fluctuate
Investors in China, facing a volatile domestic stock market, are increasingly seeking refuge in alternative assets. Amidst a faltering local economy, retail investors like Rain Yang from Jiangxi are diversifying into gold and cryptocurrencies, traditionally considered safe havens during economic uncertainty.
This shift comes as global markets, including stocks and gold, generally outperformed Chinese blue-chips last year.
Global Economic Dynamics Influence Copper Price
Copper, sensitive to economic cycles, feels these investment trends’ ripple effects. Due to the recent increase in outbound investment through the Wealth Connect scheme, Chinese household savings are shifting towards foreign market funds as yuan deposit rates decline.
Despite the restrictions of the qualified domestic institutional investor program, this international focus has heightened, reflecting a loss of confidence in the local markets and potentially a bearish outlook for copper demand within China.
Copper’s Position Amidst International Investment Patterns
As copper navigates these challenging waters, investors closely watch key economic indicators and policy decisions that may impact the metal’s demand. With China’s economy showing signs of a protracted recovery and uneven growth, copper’s trajectory remains closely tied to the nation’s economic reforms and stimulus measures.
The commodity’s path appears to mirror investor sentiment—carefully bearish as it responds to the global economic climate and investment shifts.
Copper Price Forecast: Technical Outlook
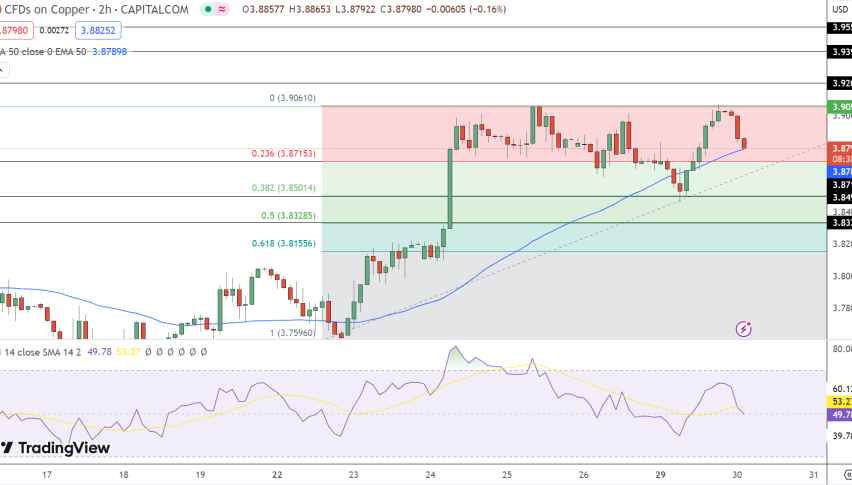
Copper prices are navigating a challenging market environment, trading at $3.89, reflecting a downturn of 0.59% within 24 hours. The 4-hour chart indicates a pivot point at $3.91, with copper facing immediate resistance at $3.92 and additional hurdles at $3.94 and $3.96.
On the downside, support levels are identified at $3.87, with further potential cushions at $3.85 and $3.83 should bearish momentum persist.
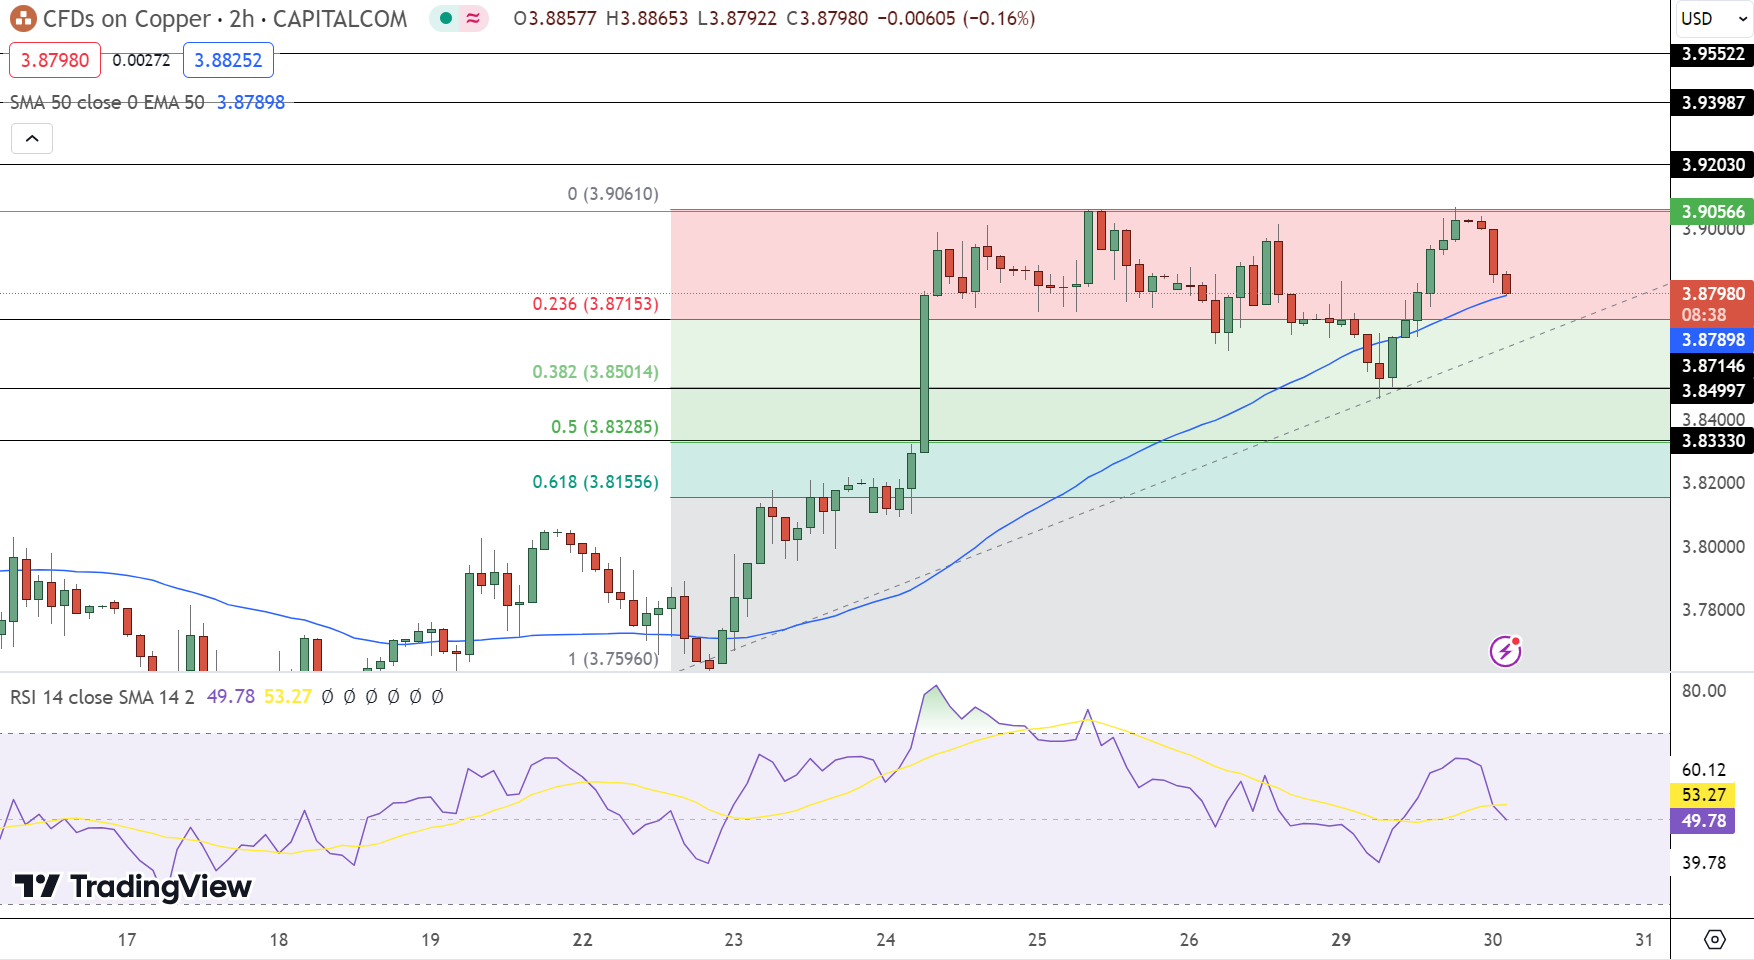
The Relative Strength Index (RSI) is neutral, hovering near the midpoint at 49, suggesting an equilibrium between buying and selling forces. The 50-day Exponential Moving Average (EMA) stands at $3.88, closely aligned with current pricing, providing neither a clear bullish nor bearish signal.
Chart analysis reveals a double-top formation around the $3.90 level. A decisive closure below this point could signify a shift towards a bearish trend for copper. This technical pattern, if confirmed, may catalyze a selling trend.
- Check out our free forex signals
- Follow the top economic events on FX Leaders economic calendar
- Trade better, discover more Forex Trading Strategies
- Open a FREE Trading Account
- Read our latest reviews on: Avatrade, Exness, HFM and XM
Related Articles


Sidebar rates
Related Posts
