Impressive Canadian GDP Can’t Keep USD/CAD Buyers Down
USD/CAD has been bullish since the end of December and after last week's bullish candlestick, this forex pair is aiming at adding gains
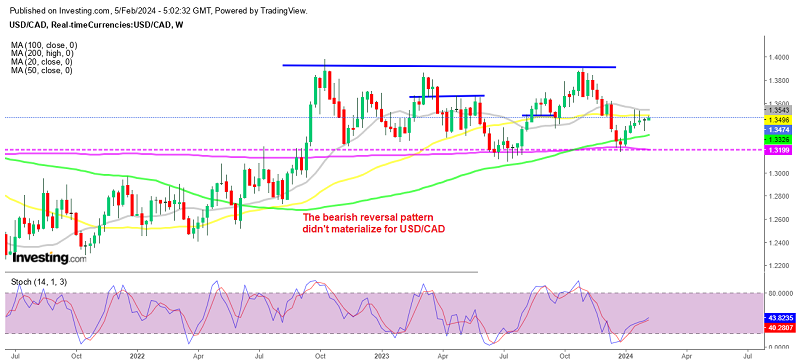
USD/CAD has been bullish since it reversed at the end of December, however, in the first half of last week the price was heading down, as traders were preparing for the impending FED meeting and Canada’s November GDP report. Both were scheduled for Wednesday and both were bullish for respective currencies, but the USD ended up winning the race and USD/CAD ended the week with a bullish candlestick, pointing to further gains this week.
The GDP reading for November showed a 0.2% expansion, against expectations of 0.1%, but the most promising indicator was the advanced GDP which showed a 0.3% expansion in December. The chemicals sub-sector expanded the fastest, as activity rose by 1.9%, while manufacturing for non-durable items increased by 1.2%, the quickest pace of expansion since March.
Repricing FED and BOC Policies
However, the most of the sectors in Canada remain in a weak shape, while we are seeing some very strong figures from the US, with the jump in Q4 GDP and the great JOLTS and NFP employment numbers. So, traders are pricing their forecasts for the FED and the BoC in different directions, pushing back the expected March cut to May by the FED, while pulling forward a Bank of Canada rate cut.
USD/CAD to Retest the 200 SMA Again This Week?

Besides that, last week’s price action looked pretty bullish. In previous weeks, the 20 SMA (gray) was rejecting the price around 1.3540 which acted as resistance and last week’s low came at 1.358. But, the price situation reversed and closed right at the opening levels, forming an upside-down pin candlestick, which points to further bullish momentum.
This technical chart setup indicates that USD/CAD will likely rise to 13540s first where buyers will meet the 20 weekly SMA again and then push higher to 1.3800 by early spring after the 20 SMA gives way. Above there, the way is open until the 1.39-40 zone where this pair has been finding resistance since summer 2022.
USD/CAD Live Chart
- Check out our free forex signals
- Follow the top economic events on FX Leaders economic calendar
- Trade better, discover more Forex Trading Strategies
- Open a FREE Trading Account
- Read our latest reviews on: Avatrade, Exness, HFM and XM
Related Articles
Sidebar rates
Related Posts
