Crude Oil Weekly Forecast: Surging on Chinese Recovery and Inventory Surprise, Eyes on $77.78 Mark
The Crude Oil (USOIL) price forecast concluded the week on a downward note at $77.78, representing a 2.47% decline amidst volatile market dy
The Crude Oil (USOIL) price forecast concluded the week on a downward note at $77.78, representing a 2.47% decline amidst volatile market dynamics, though it closed positively on Friday. The prospect of the Federal Reserve (Fed) reducing interest rates this year, coupled with a weaker US Dollar (USD), nudged WTI prices upward.
Chinese Trade Data Signals Economic Recovery
During the last week, Thursday’s release of Chinese Import and Export data for February surpassed expectations, signaling a robust recovery in the world’s second-largest economy. This development offers a boost to WTI prices, considering China’s status as the premier global crude oil consumer.
Fed Chair’s Comments Raise Market Optimism
Fed Chairman Jerome Powell’s remarks on Thursday, suggesting that interest rates have likely reached their zenith with expectations of a reduction later this year, bolstered WTI prices. A softer interest rate environment typically fosters an uptick in oil demand, positively influencing WTI prices.
US Crude Inventory Report Surprises the Market
Moreover, a less-than-anticipated increase in US crude oil inventories according to the latest EIA report—only 1.367M barrels per day for the week ending March 1—versus an expected rise of 2.166M bpd, spurred optimism among traders regarding WTI prices.
Upcoming Economic Indicators to Watch
The forthcoming revision of the Eurozone GDP for Q4, along with the US Nonfarm Payrolls, Unemployment Rate, and Average Hourly Earnings for February, are eagerly awaited by oil traders. These indicators could significantly influence Crude Oil (USOIL) prices, offering traders opportunities to gauge the market’s direction and strategize accordingly.
Crude Oil (USOIL) Price Forecast: Technical Outlook
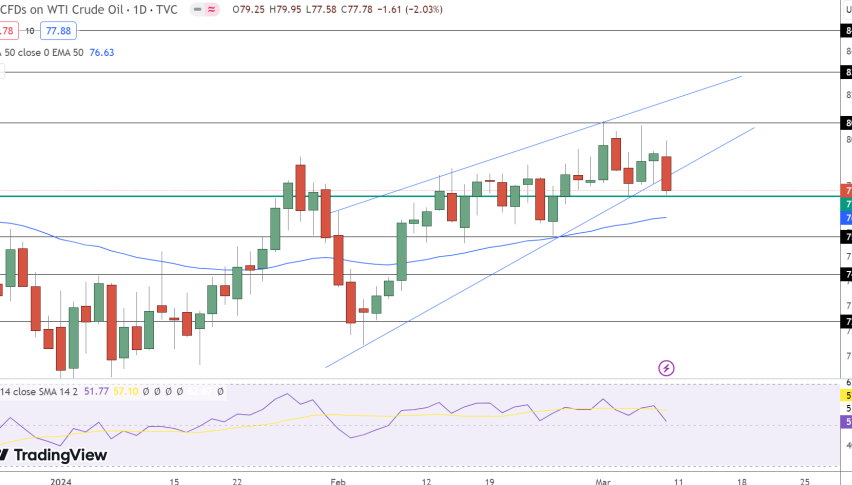
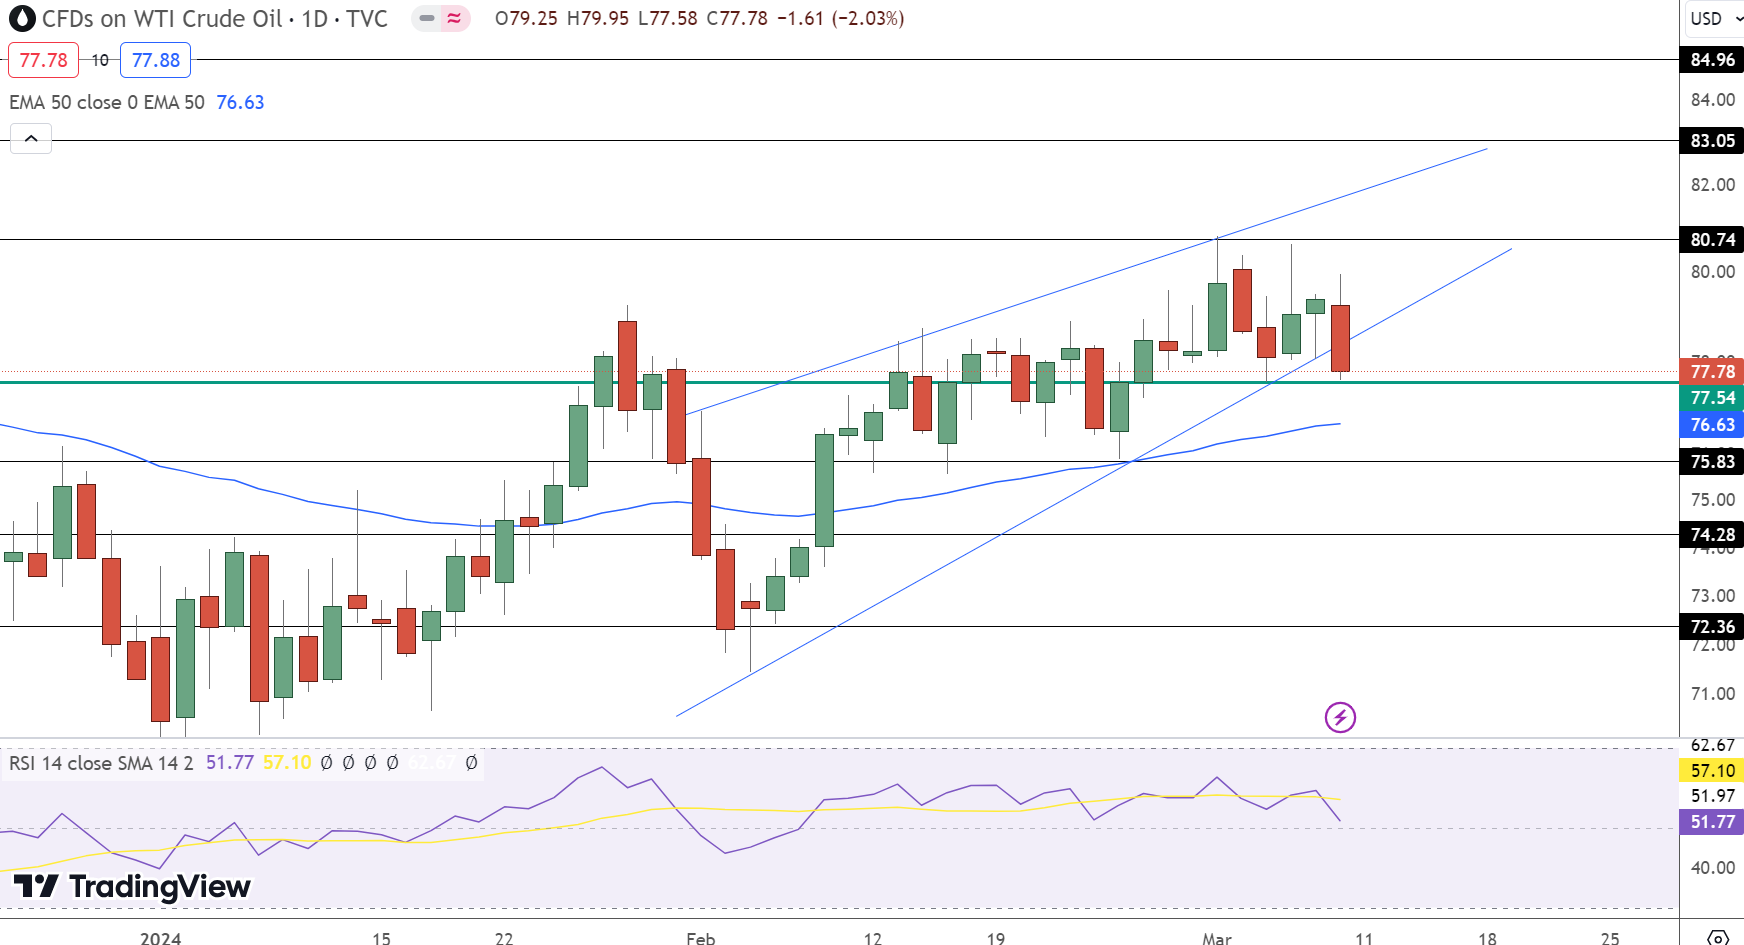
Crude Oil (USOIL) ended the week at $77.78, marking a 2.47% decrease, amidst fluctuating market conditions. The asset’s pivot point at $77.54 is critical for determining its immediate market direction. Resistance levels are established at $80.74, $83.05, and $84.96, delineating potential hurdles in upward price movement. Conversely, support levels at $75.83, $74.28, and $72.36 provide a safety net against further declines.
Technical indicators offer a mixed outlook. The Relative Strength Index (RSI) at 51 suggests a market in balance, neither overbought nor oversold, while the 50-Day Exponential Moving Average (EMA) at $76.63 indicates underlying bullish sentiment. However, the recent formation of a bearish engulfing candle on the daily timeframe sends a potent signal for a potential downtrend, challenging the optimistic view provided by the 50 EMA and RSI levels.
In conclusion, Crude Oil’s market stance is at a pivotal juncture. While indicators above the pivot point at $77.54 hint at bullish potential, a break below this level could precipitate a significant selling trend. Investors and traders should closely monitor these key levels and indicators to navigate the volatile oil market effectively.
- Check out our free forex signals
- Follow the top economic events on FX Leaders economic calendar
- Trade better, discover more Forex Trading Strategies
- Open a FREE Trading Account
- Read our latest reviews on: Avatrade, Exness, HFM and XM
Related Articles


Sidebar rates
Related Posts
