S&P 500 Wavers at $5100 Amid Rate Cut Speculation and Geopolitical Strains
Despite the upbeat US Nonfarm Payrolls (NFP) report, the global market sentiment has been on the bearish track, as indicated by the bearish.
Despite the upbeat US Nonfarm Payrolls (NFP) report, the global market sentiment has been on the bearish track, as indicated by the bearish performance of the S&P 500 index, which hit the intra-day low around $5,117.
The decline in the S&P 500 was influenced by downbeat US labor data, which showed the jobless rate in the US rose to 3.9% from expectations and the prior reading of 3.7%.
However, the rise in the jobless rate, lower-than-expected wage growth, and downward revisions in payrolls typically put pressure on the index as investors react unfavorably to signs of economic weakness.
Mixed Signals in the US Economy and Market Uncertainty
On the US front, Federal Reserve policymakers are cautious about lowering interest rates until they are confident inflation will consistently stay around the 2% target. At the time of writing, the CME FedWatch tool indicates a 57% chance of a 25 basis point rate cut in June, but traders aren’t heavily betting on it due to mixed economic signals.
On the data front, the February Nonfarm Payrolls report revealed a strong labor market, adding 275,000 jobs, beating predictions. However, the Unemployment Rate rose to 3.9%, and wage growth dipped slightly to 4.3%.
Despite this, Fed Chair Powell hinted that the central bank is wary of lowering rates, but speculation of a rate cut in June caused the dollar to weaken. It means the job market is doing well, but there are concerns about unemployment and wage growth.
Therefore, the mixed signals from the US economy regarding interest rates and labor market strength lead to volatility for the S&P 500 Index, influenced by uncertainty in global markets.
Geopolitical Tensions Impacting the S&P 500 Index
On the geopolitical front, the ongoing tensions in the Middle East and worries about a global economic slowdown in 2024 are causing the S&P 500 index to drop. It should be noted that the UNRWA reports hunger in Gaza during Ramadan, urging a ceasefire. Meanwhile, the tensions rise due to alleged Israeli actions like barring Palestinians from al-Aqsa Mosque.
S&P500 Price Forecast: Technical Outlook
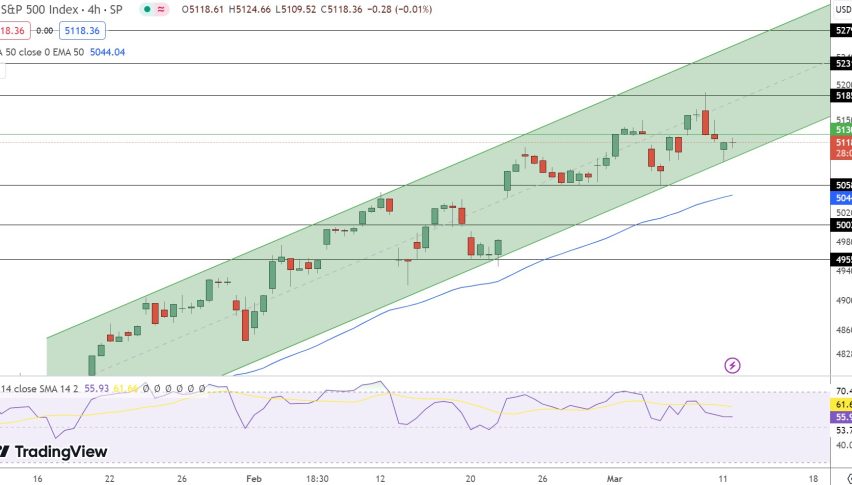
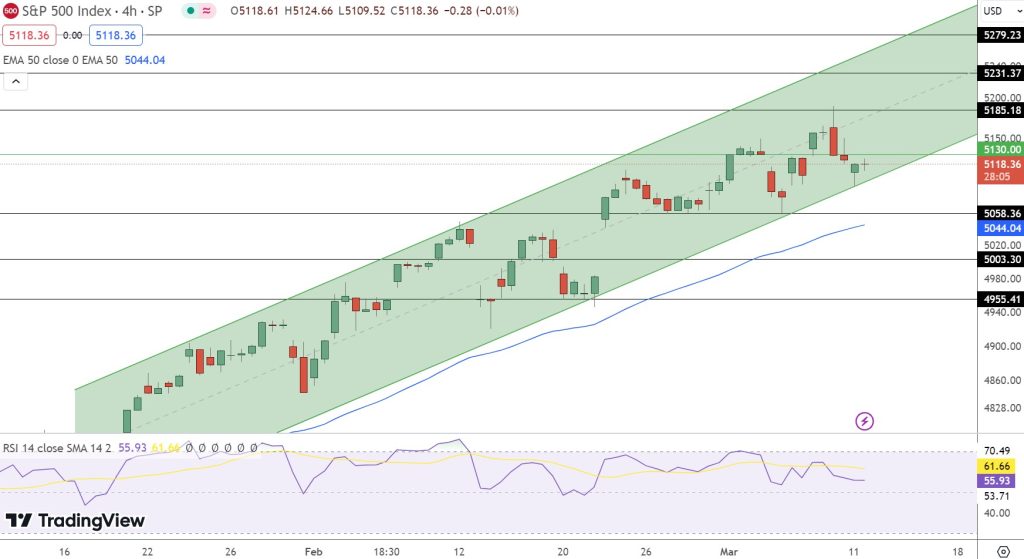
S&P 500 Index is currently sitting at $5118.36, navigates within an ascending channel, suggesting a continued uptrend. The pivot point—our green line—stands at $5118.36, with the index hovering just above this critical level.
Resistance for the S&P 500 lies at $5227, $5231.37, and $5279.23, marking potential ceilings that could challenge upward progression. Meanwhile, support levels are established at $5080, $5058.36, and slightly lower, offering a cushion should a reversal occur.
The 50-day Exponential Moving Average (EMA) at $5044.04 aligns with the lower boundary of the channel, bolstering the buying sentiment. Additionally, the Relative Strength Index (RSI) at 61.66 remains in bullish territory, supporting potential for further gains.
In conclusion, the S&P 500 Index exhibits a bullish trend with a preference for buying near the $5080 level, reinforced by the 50 EMA and RSI readings. The overall trend could shift to bearish if the index falls below $5130, but for now, the indicators lean toward an upside continuation.
- Check out our free forex signals
- Follow the top economic events on FX Leaders economic calendar
- Trade better, discover more Forex Trading Strategies
- Open a FREE Trading Account
- Read our latest reviews on: Avatrade, Exness, HFM and XM

Related Articles

Sidebar rates

Related Posts
 Save
Save