WTI Crude Oil at $77.65: Fed Comments and Inventory Rise Impact Prices
WTI Crude Oil is currently priced at $77.61, down 0.23%. The pivot point is at $78.18. Immediate resistance levels are at $79.14, $80.03,

WTI Crude Oil is currently priced at $77.61, down 0.23%. The pivot point is at $78.18. Immediate resistance levels are at $79.14, $80.03, and $81.20. On the downside, immediate support is at $76.16, with further supports at $75.18 and $74.51.
The 50-day Exponential Moving Average (EMA) is $78.59, while the 200-day EMA is $79.66. The technical outlook for USOIL is bearish below the pivot point of $78.18. A break above this level could shift the bias to bullish, targeting higher resistance levels.
Conversely, staying below $78.18 may lead to testing lower support levels, maintaining downward pressure.
Fed Comments and Inventory Data Impact
Oil prices declined early Friday as U.S. Fed officials indicated it was premature to consider rate cuts. Dallas Federal Reserve President Lorie Logan highlighted ongoing inflation concerns, advocating for flexible monetary policy.
This sentiment, combined with an unexpected rise in U.S. gasoline stocks, pressured the market. WTI Crude Oil prices dropped by 0.22% to $77.74, while Brent futures decreased by 0.15% to $81.74.
U.S. Inventory Changes
The Energy Information Administration (EIA) reported a fall in U.S. crude oil inventories by 4.2 million barrels to 454.7 million barrels for the week ending May 24.
This was more than double the anticipated draw of 1.9 million barrels. In contrast, gasoline inventories increased by 2 million barrels to 228.8 million barrels, against an expected draw of 400,000 barrels, ahead of the Memorial Day weekend.
OPEC+ Production Cuts
OPEC+ is negotiating a complex deal to extend oil production cuts into 2025. The group, led by Saudi Arabia and Russia, is currently reducing output by 5.86 million barrels per day, which constitutes about 5.7% of global demand.
This potential extension aims to stabilize the market amid fluctuating demand and geopolitical uncertainties.
WTI Crude Oil Price Forecast – Technical Outlook
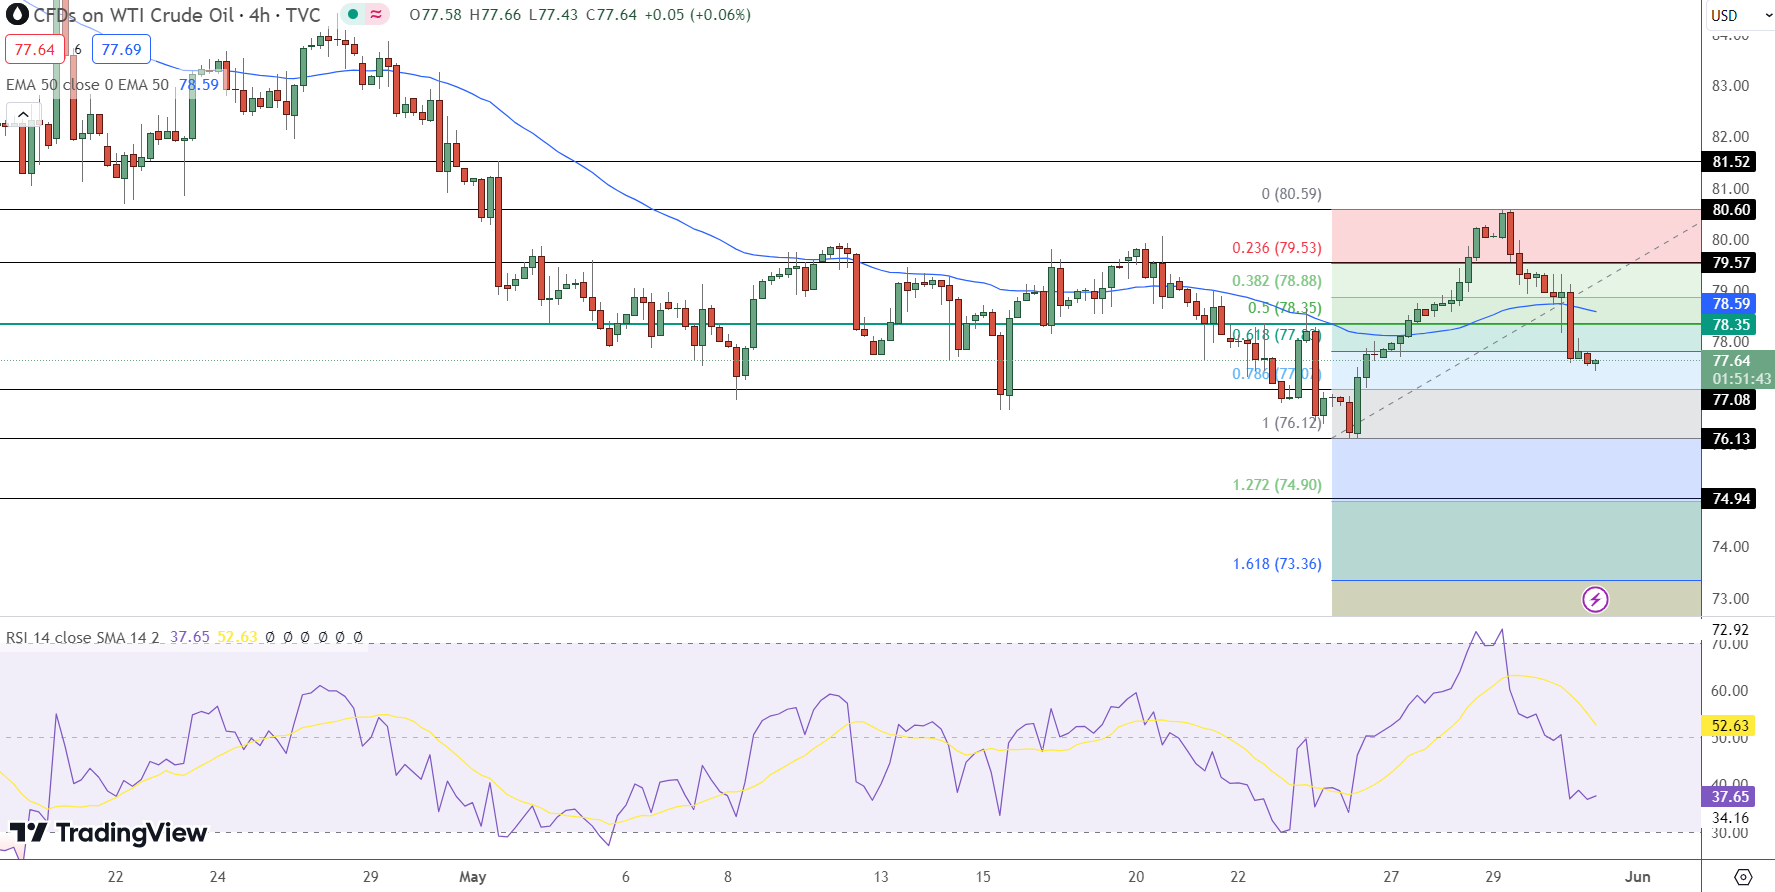
USOIL is currently trading at $77.64, down 0.23%. The pivot point is set at $78.35, marked by the green line. Immediate resistance levels are at $79.57, $80.60, and $81.52.
On the downside, immediate support is at $77.08, with further supports at $76.13 and $74.94. The 50-day Exponential Moving Average (EMA) is $78.59, indicating a potential resistance level, and the Relative Strength Index (RSI) stands at 37, reflecting a bearish sentiment.
The technical outlook for USOIL remains bearish below the pivot point of $78.35. A break above this level could shift the bias to bullish, targeting higher resistance levels. Conversely, remaining below $78.35 may lead to testing lower support levels, suggesting continued downward pressure.
- Check out our free forex signals
- Follow the top economic events on FX Leaders economic calendar
- Trade better, discover more Forex Trading Strategies
- Open a FREE Trading Account
- Read our latest reviews on: Avatrade, Exness, HFM and XM
Related Articles


Sidebar rates
Related Posts
