The Decline Resumes in USDJPY As the 146 Support Breaks
The trend in USDJPY has shifted since July and yesterday's break of the support at 146 confirmed the bearish bias in this forex pair.
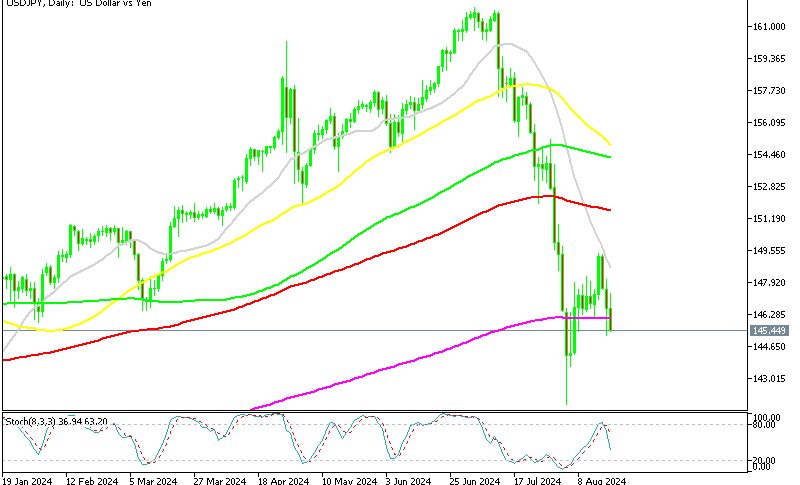
The trend in USDJPY has shifted since July and yesterday’s break of the support at 146 confirmed the bearish bias in this forex pair. The bounce last week failed at the 20 daily SMA and sellers resumed control, with the BOJ turning hawkish recently, which points to further declines for this forex pair.
USD/JPY Chart Daily – The 200 SMA Has Been Broken
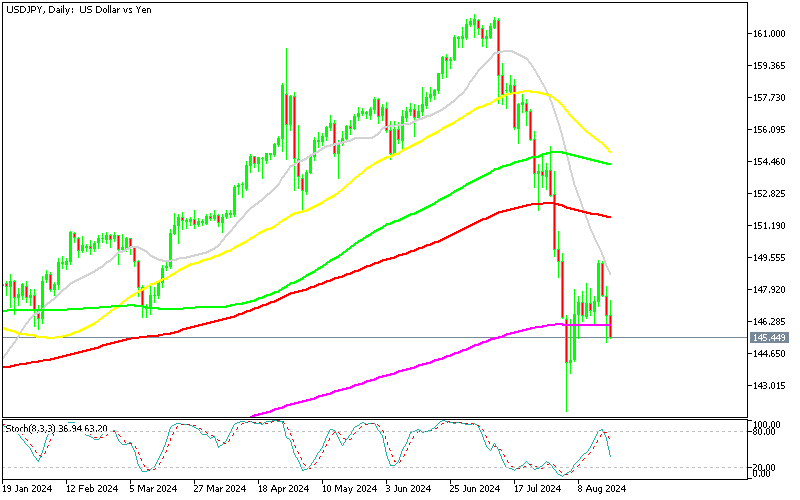
The USD/JPY exchange rate has been highly volatile, influenced by contrasting monetary policies between the Federal Reserve and the Bank of Japan. As the US Treasury market begins to signal economic distress and potential rate cuts, USD/JPY initially surged past 146.00 but quickly dropped below 145.50, losing 60 pips. The yield on Treasury notes fell by about 10 basis points, pushing the pair lower. The Federal Reserve is widely expected to cut rates in September, in contrast to the BOJ’s recent 15 basis point rate hike, which has fueled speculation of further tightening in Japan.
USD/JPY Sellers Gain Momentum as USD Weakness Persists
Earlier this month, USD/JPY experienced significant volatility, briefly rising above 149 before consolidating for about a week. The pair attempted to break above the 20-day SMA but failed, leading to a sharp decline. The 200 SMA, which had provided support since early last week, was breached yesterday as sellers capitalized on continued USD weakness. With this break below key support levels, sellers now have the door open for further losses in the pair.
Japan Trade Balance Report for July
USD/JPY Live Chart
- Check out our free forex signals
- Follow the top economic events on FX Leaders economic calendar
- Trade better, discover more Forex Trading Strategies
- Open a FREE Trading Account
- Read our latest reviews on: Avatrade, Exness, HFM and XM
Related Articles


Sidebar rates
Related Posts
