Forex Signals Brief August 26: USD Bulls Hope on Durable Goods Orders
The US Dollar has been bearish throughout August, but mind the Durable Goods Orders today which might give it a boost.

Last week the calendar was empty in the first half, apart from the CPI consumer inflation data from Canada, which showed a bigger slowdown than expected, sending the CAD lower. However, the CAD ended up higher against the USD by the end of the week as the Buck resumed the downtrend.

Gold kept surging higher, reaching a new record high at $2,431 by Wednesday. But on Thursday it retreated below $2.500, as the USD found some bids after positive Home Sales data and stable Unemployment Claims, but that didn’t last long, with markets expecting a dovish Powell at the Jackson Hole Symposium.
Powell confirmed the start of the monetary easing process in September, which makes this the official dovish turn from the FED. Besides that, he didn’t reject the idea of a 50 bps rate cut, which the market saw as even more dovish, which sent the USD down the drain again, while everything else closed the week near the highs.
This Week’s Market Expectations
Last week markets were slow in the first half, but the USD weakness persisted, so we remained short on the USD, and long on Gold which proved to be a good trading strategy. The volatility increased toward the end of the week, but we kept the same performance, ending the week with 23 closed trading signals, 16 of which were winning forex signals, while 7 ended up in loss, giving us a great win/loss ratio.
Gold Holds Above $2,500
Early in the week, gold reached a new high of $2,531, but by Thursday, it had sharply dropped $60 to $2,470. This decline followed positive US economic data, including better-than-expected home sales that halted the previous month’s downward trend and a Services PMI that rose by more than 55 points, signaling strong growth in the services sector. Despite these data points, Fed Chair Jerome Powell’s dovish stance pushed gold back above $2,500.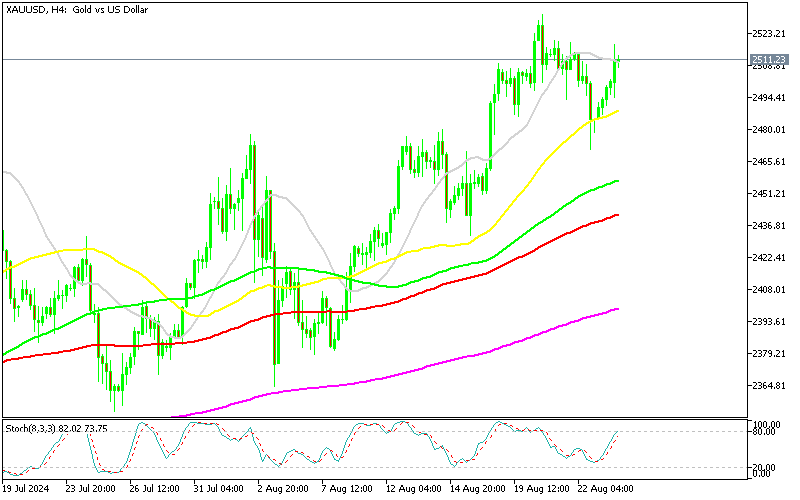
XAU/USD – Daily chart
GBP/USD Closes the Day With A Doji
The GBP/USD pair has shown significant resilience, rebounding off the moving averages on the daily chart. After strong UK Services and Manufacturing PMI readings, the pair rose to 1.3130 early in the week. However, it later dropped below 1.31, finding support at the 50-day SMA (yellow). Another surge on Friday saw the pair close the week above 1.32.
GBP/USD – Daily Chart
Cryptocurrency Update
Bitcoin Holds Above $60k but the 50 SMA Keeps It Down

BTC/USD – Daily chart
Ethereum Remains Subdued by the 20 Daily SMA
Since March, Ethereum has been in a downtrend, with lower highs suggesting the potential for further declines in August. In June, Ethereum briefly rallied above the 50-day SMA after falling from $3,830 to below $3,000, but renewed selling pressure led to another bearish reversal. The price fell through the 200-day SMA before recovering to above $2,600. Currently, buyers are testing the 20-day SMA (gray), which could trigger a battle between bulls and bears.
ETH/USD – Daily chart
- Check out our free forex signals
- Follow the top economic events on FX Leaders economic calendar
- Trade better, discover more Forex Trading Strategies
- Open a FREE Trading Account
- Read our latest reviews on: Avatrade, Exness, HFM and XM
Related Articles


Sidebar rates
Related Posts
